Saddle Point
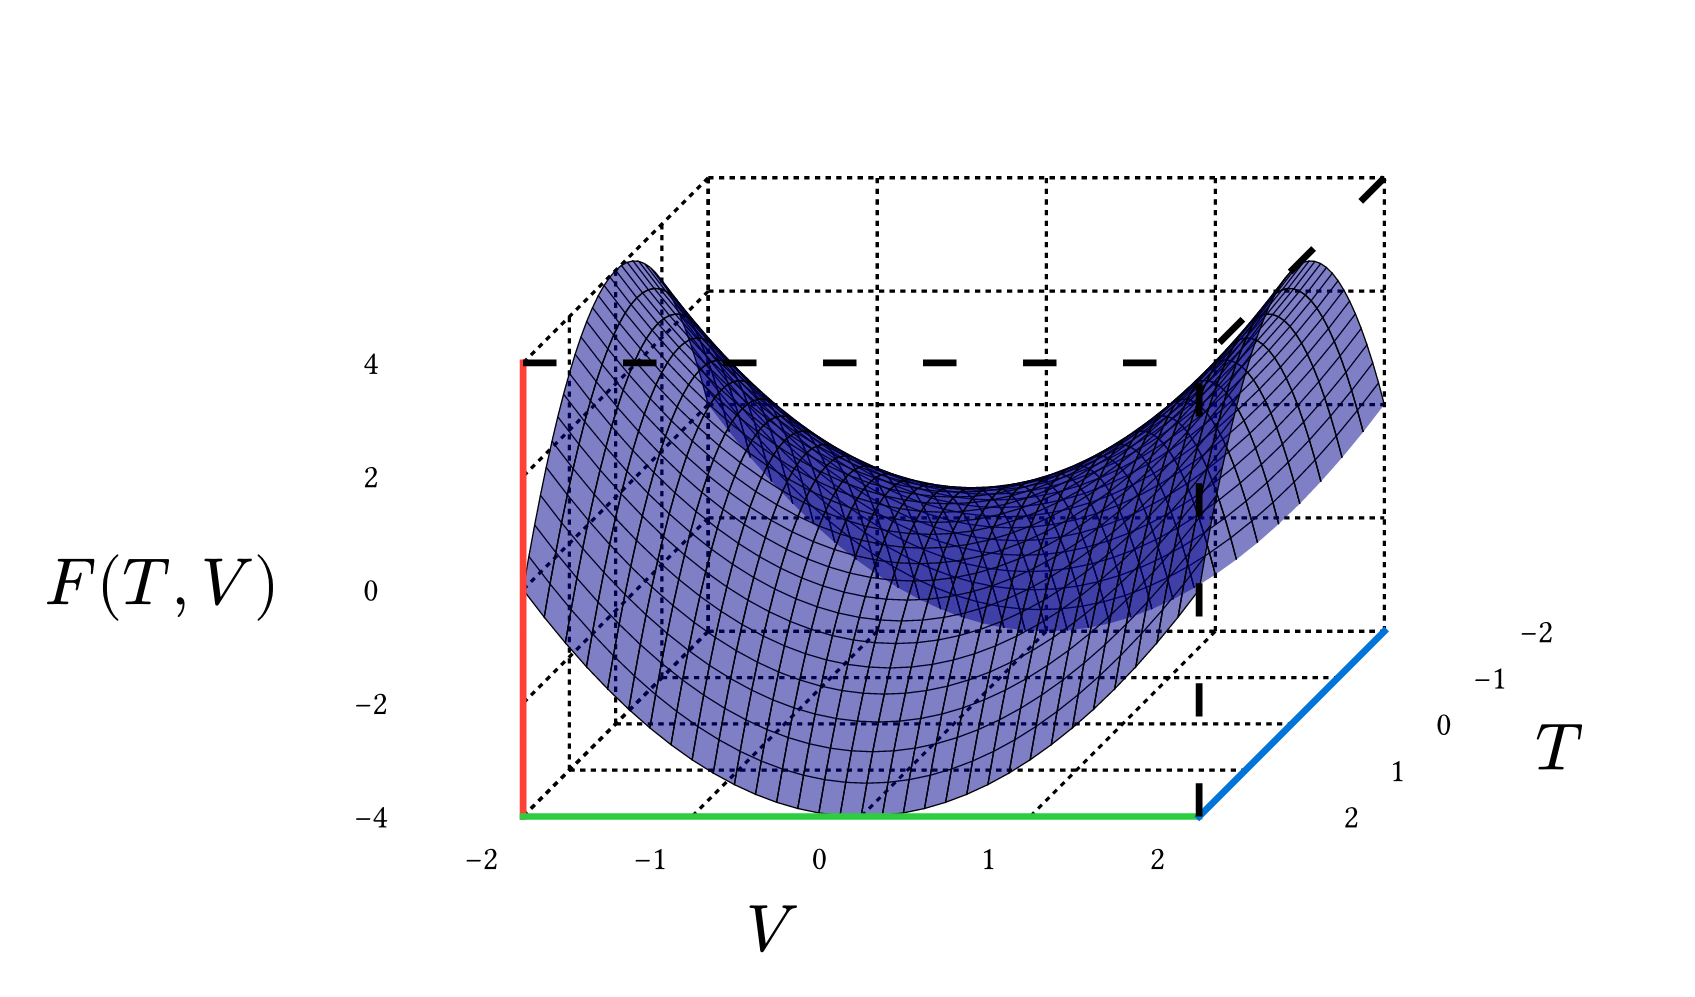
This graph depicts a saddle point in three-dimensional space, which is a point in the domain of a function that is a local minimum in one direction and a local maximum in another. The depicted function is quadratic in and , and the graph shows the convex and concave nature of the function along different axes.
Download
Code
#import "@preview/plotsy-3d:0.2.1": plot-3d-surface

#set page(width: auto, height: auto, margin: 8pt, fill: none)
#set text(size: 12pt)

#let domain-size = 2

// F(T, V) = V^2 - T^2: convex along V, concave along T, so the origin is a saddle.
// An explicit `scale-dim` is needed since the package default (1, 1, 0.5) renders ~12x too large.
#plot-3d-surface(
  (v, t) => v * v - t * t,
  color-func: (..) => rgb("#00008B").transparentize(50%),
  subdivisions: 8,
  xdomain: (-domain-size, domain-size),
  ydomain: (-domain-size, domain-size),
  scale-dim: (0.1, 0.06, 0.03),
  axis-label-size: 1em,
  axis-label-offset: (0.16, 0.12, 0.12),
  axis-labels: ($V$, $T$, $F(T,V)$),
  axis-step: (1, 1, 2),
)