Signal Sampling
Creator: Petar Veličković (original)
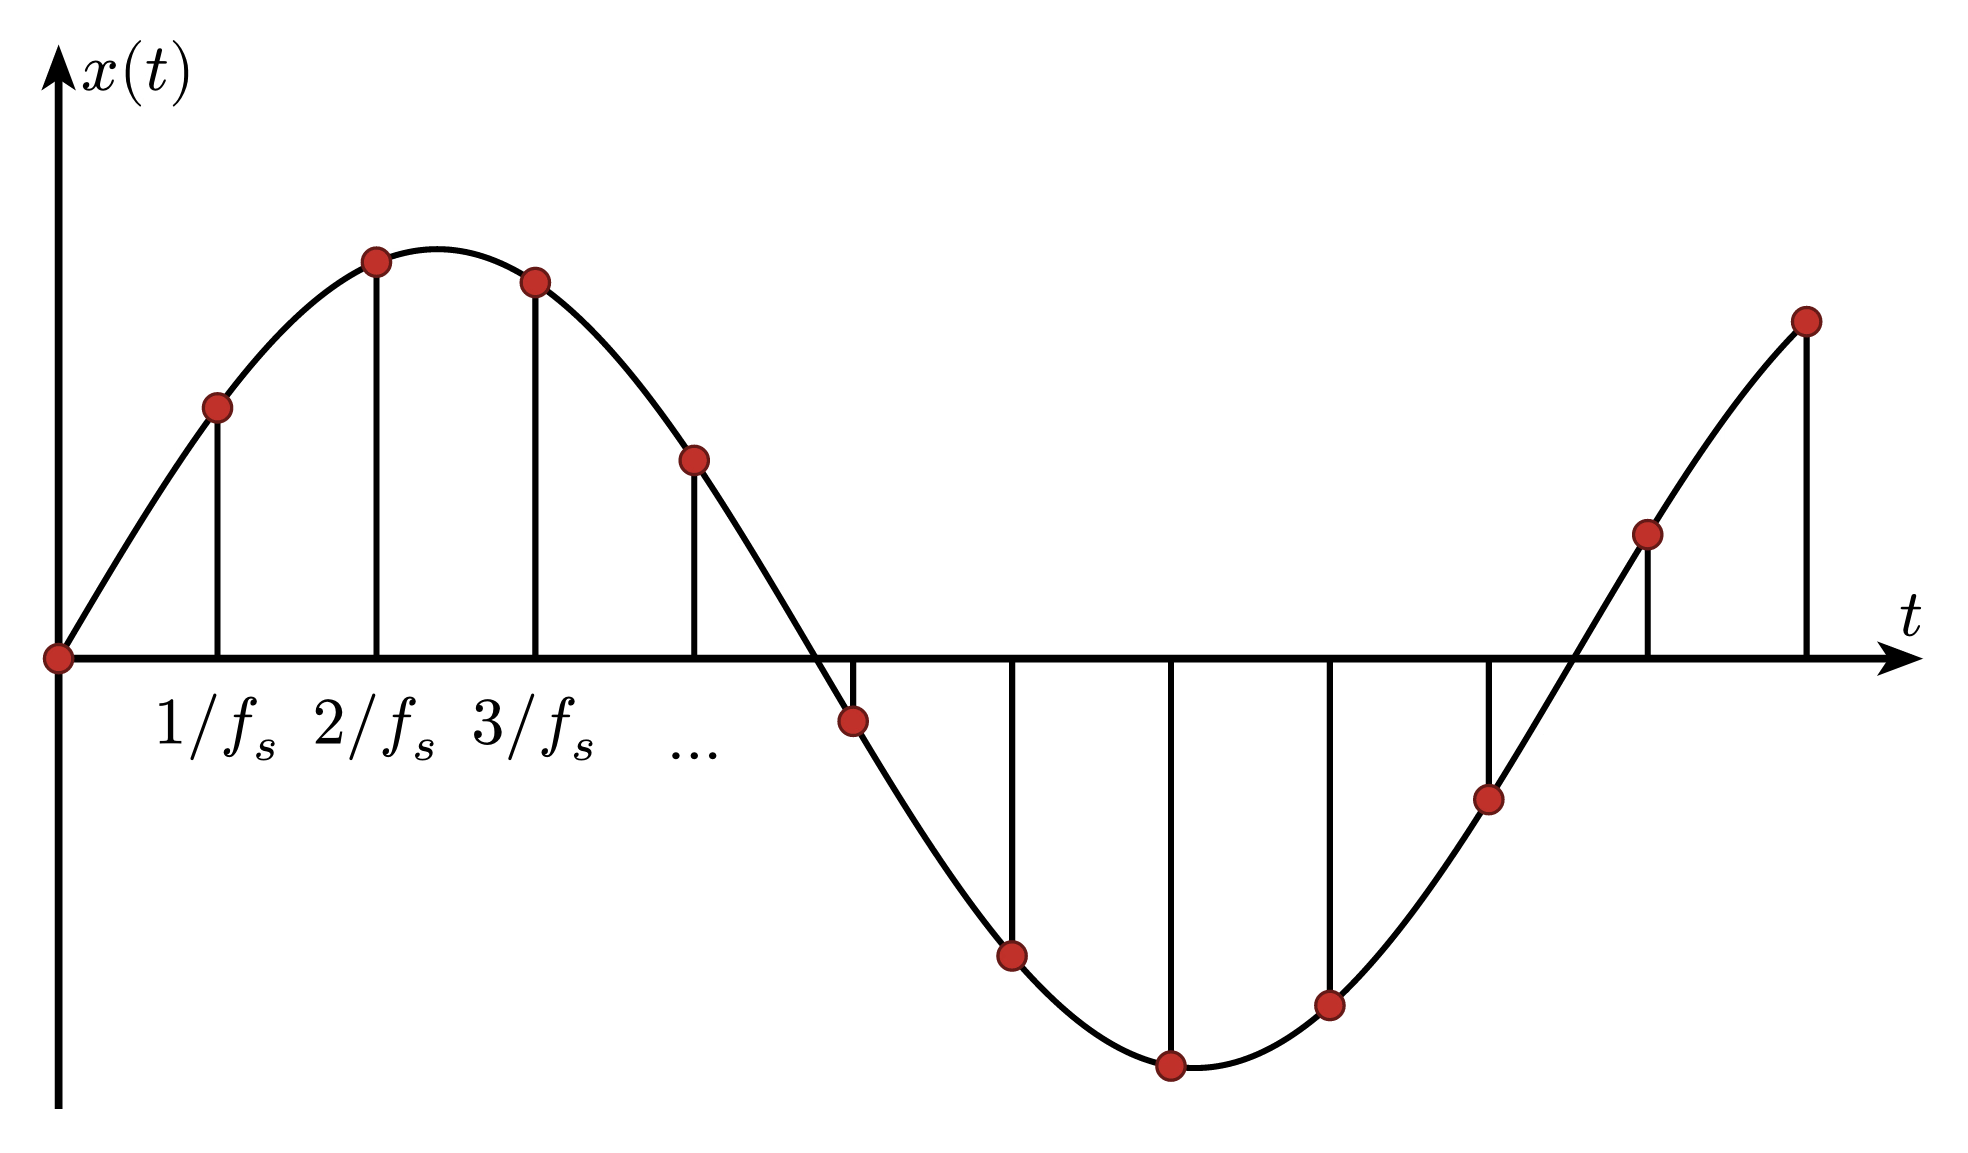
Sampling discretizes a continuous-time signal by recording its amplitude at regular intervals spaced by the inverse sampling frequency.
Download
Code
signal-sampling.typ (44 lines)
#import "@preview/cetz:0.5.2": canvas, draw
#import draw: circle, content, line

#set page(width: auto, height: auto, margin: 8pt, fill: none)
#set text(size: 12pt)

#let signal(t) = calc.sin(2 * calc.pi * t / 13)
#let scale-x = .74
#let scale-y = 2.6
#let pt(t) = (t * scale-x, signal(t) * scale-y)
#let n-samples = 12
#let sample-period = 15 / (n-samples - 1)

#canvas({
  let arrow = (mark: (end: "stealth", fill: black, scale: .8), stroke: 1.4pt)

  // axes (axis lines = middle)
  line((0, -1.1 * scale-y), (0, 1.5 * scale-y), ..arrow, name: "y-axis")
  line((0, 0), (16 * scale-x, 0), ..arrow, name: "x-axis")
  content("y-axis.end", $x(t)$, anchor: "north-west", padding: (left: 4pt))
  content("x-axis.end", $t$, anchor: "south-east", padding: (bottom: 4pt))

  // continuous signal
  line(..range(301).map(idx => pt(idx * 15 / 300)), stroke: 1.1pt)

  // sampled stems with dots
  for idx in range(n-samples) {
    let t = idx * sample-period
    line((t * scale-x, 0), pt(t), stroke: 1.1pt)
    circle(
      pt(t),
      radius: .09,
      fill: red.darken(25%),
      stroke: red.darken(60%) + .6pt,
    )
  }

  // sample-time tick labels
  for (idx, label) in ((1, $1 \/ f_s$), (2, $2 \/ f_s$), (3, $3 \/ f_s$)) {
    content((idx * sample-period * scale-x, -.25), label, anchor: "north")
  }
  content((4 * sample-period * scale-x, -.35), $dots$, anchor: "north")
})