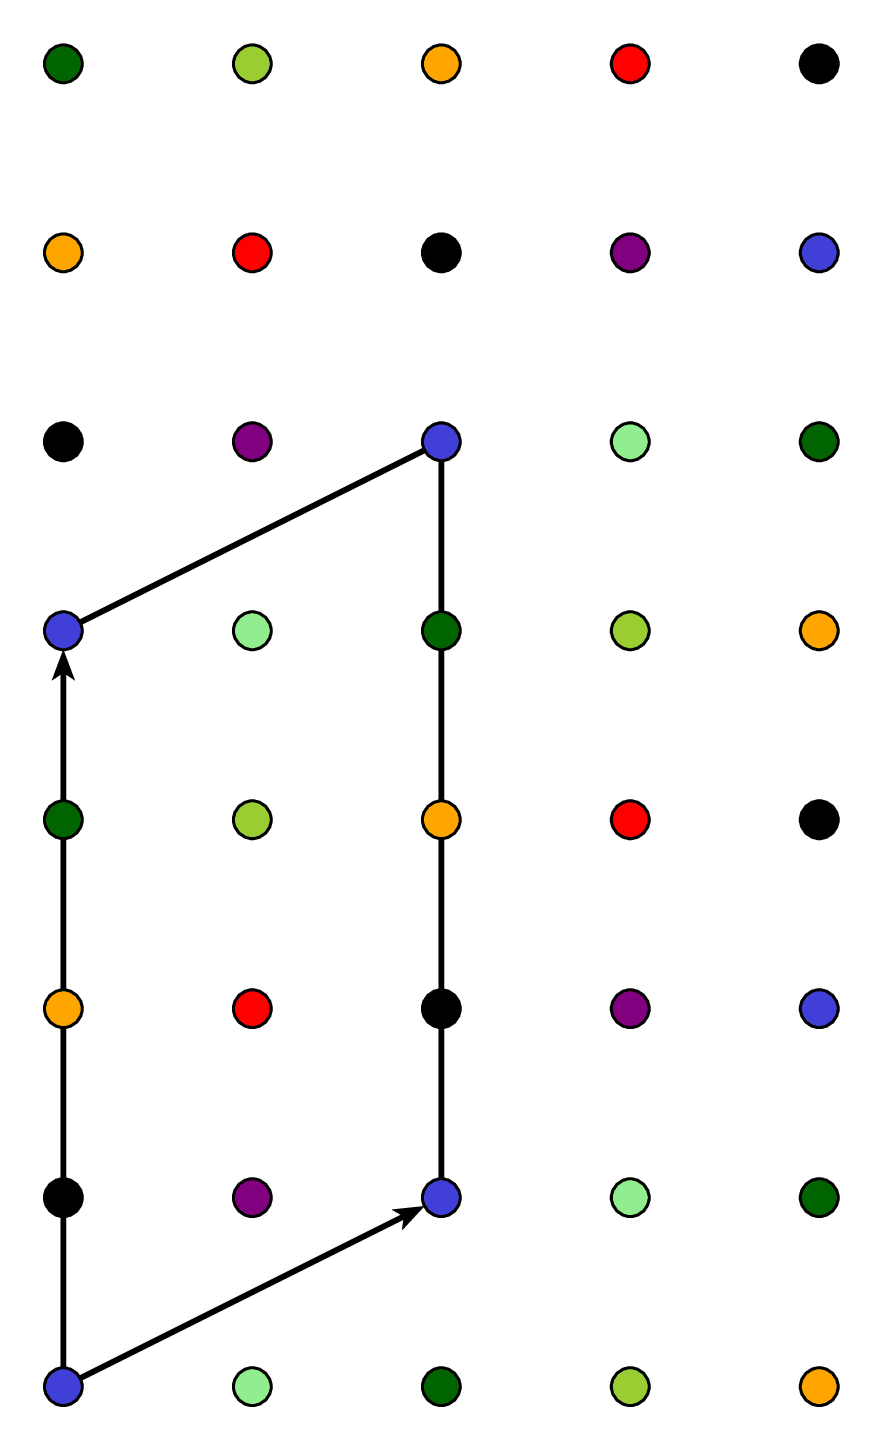
Visualization of lattice points with basis vectors showing a fundamental domain. The points are colored to show the periodicity of the lattice, with points of the same color related by lattice translations. The arrows indicate the basis vectors that generate the lattice.
#import "@preview/cetz:0.3.4": canvas, draw
#import draw: line, content, circle, on-layer
#set page(width: auto, height: auto, margin: 8pt)
// Atom with 3D shading effect
#let shaded-circle(pos, color, radius: 0.1, name: none, stroke: 0.2pt) = {
circle(
pos,
radius: radius,
stroke: stroke,
fill: gradient.radial(
color.lighten(85%),
color,
color.darken(25%),
focal-center: (25%, 20%),
focal-radius: 10%,
center: (30%, 25%),
),
name: name,
)
}
#canvas({
// Define styles and constants
let grid-size = 2 // number of points in each direction
let spacing = 0.6 // spacing between points
let dot-radius = 0.1
// Colors in order of appearance
let colors = (
rgb("#4040d9"), // blue
rgb("#90EE90"), // light green
rgb("#006400"), // dark green
rgb("#9ACD32"), // yellow green
rgb("#FFA500"), // orange
rgb("#FF0000"), // red
rgb("#000000"), // black
rgb("#800080"), // purple
)
for ii in range(0, 5) {
for jj in range(0, 8) {
let x = 2 * ii * spacing
let y = 2 * jj * spacing
// Every 2 right and 1 up is same color
// Use modulo to cycle through colors
let color-idx = calc.rem(ii - 2 * jj, colors.len())
if color-idx < 0 { color-idx += colors.len() }
// Use the shaded-circle function instead of regular circle
shaded-circle(
(x, y),
colors.at(color-idx),
radius: dot-radius * 1.2,
name: str(ii) + "," + str(jj),
)
}
}
// Add arrows to show basis vectors
let arrow-style = (
mark: (end: "stealth", fill: black, scale: .5),
stroke: 1pt,
)
on-layer(
-1,
{
line("0,0", "2,1", ..arrow-style)
line("0,0", "0,4", ..arrow-style)
line("2,1", "2,5")
line("0,4", "2,5")
},
)
})