Torus Fundamental Domain
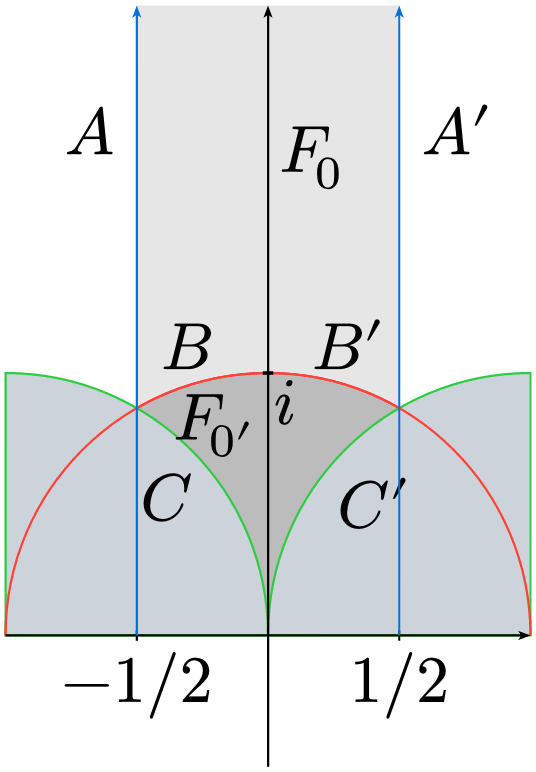
The light gray-shaded areas show a fundamental domain of a torus under modular transformations. The diagram shows the region in the complex plane that uniquely parametrizes inequivalent tori, bounded by the modular projective special linear group PSL(2,Z) transformations that identify physically equivalent fundamental domains for the action of on the upper half-plane.
Download
Code
torus-fundamental-domain.typ (99 lines)
#import "@preview/cetz:0.5.2": canvas, draw
#import draw: arc, content, line, rect

#set page(width: auto, height: auto, margin: 1pt, fill: none)

#let (xmin, xmax) = (-1, 1)
#let (ymin, ymax) = (-0.5, 2.4)

// Set global styles
#let arrow-style = (
  mark: (end: "stealth", fill: black, scale: 0.2),
  stroke: (thickness: 0.4pt),
)
#set text(size: 12pt)

// TODO this figure needs revisiting to get the gray-shaded areas right without overlaying opaque fills once CetZ implements path clipping
// https://github.com/cetz-package/cetz/discussions/813#discussioncomment-12218646
#canvas({
  draw.set-style(stroke: (thickness: 0.4pt))
  draw.set-viewport((0, 0), (20, 20), bounds: (12, 12))

  // Light gray vertical strip
  rect(
    (-0.5, 0),
    (0.5, ymax),
    fill: rgb(128, 128, 128).lighten(80%),
    stroke: none,
  )
  // Draw semicircle B and B' (dark red)
  arc(
    (0, 0),
    radius: 1,
    start: 0deg,
    stop: 180deg,
    stroke: (paint: red),
    fill: gray.transparentize(30%),
    name: "B-arc",
    anchor: "origin",
  )
  for (start, name, arc-anchor, label-anchor, label-pos, label) in (
    (0deg, "C-arc", "start", "north-east", "C-arc.20%", $C$),
    (90deg, "C-prime-arc", "arc-end", "north-west", "C-prime-arc.25%", $C'$),
  ) {
    arc(
      (0, 0),
      radius: 1,
      start: start,
      stop: start + 90deg,
      mode: "PIE",
      stroke: (paint: green),
      fill: rgb("#cdd3da"),
      name: name,
      anchor: arc-anchor,
    )
    content(label-pos, label, fill: green, anchor: label-anchor, padding: 2pt)
  }
  // Draw semicircle B and B' (dark red)
  arc(
    (0, 0),
    radius: 1,
    start: 0deg,
    stop: 180deg,
    stroke: (paint: red),
    name: "B-arc",
    anchor: "origin",
  )

  line((xmin, 0), (xmax, 0), ..arrow-style, name: "x-axis")
  line((0, ymin), (0, ymax), ..arrow-style, name: "y-axis")

  for (x, name, label) in ((-0.5, "x-minus-tick", $-1 \/ 2$), (0.5, "x-plus-tick", $1 \/ 2$)) {
    line((x, -0.02), (x, 0.02), name: name)
    content((rel: (0, -0.08), to: name + ".mid"), label, anchor: "north")
  }

  line((-0.02, 1), (0.02, 1), name: "i-tick", stroke: (thickness: 0.6pt))
  content("i-tick", $i$, anchor: "north-west", padding: 1pt)

  content("B-arc.60%", $B$, fill: red, anchor: "south", padding: (0, 0, 3pt))
  content("B-arc.40%", $B'$, fill: red, anchor: "south", padding: (0, 0, 3pt))

  for (x, name, label, anchor, padding) in (
    (-0.5, "A-line", $A$, "east", (0, 4pt, 0, 0)),
    (0.5, "A-prime-line", $A'$, "west", (0, 0, 0, 4pt)),
  ) {
    line(
      (x, 0),
      (x, ymax),
      stroke: (paint: blue),
      mark: (end: "stealth", fill: blue, scale: 0.2),
      name: name,
    )
    content(name + ".80%", label, fill: blue, anchor: anchor, padding: padding)
  }

  content("y-axis.80%", $F_0$, anchor: "west", padding: (0, 0, 0, 2pt))
  content((rel: (-0.2, -0.2), to: "B-arc.50%"), $F_0'$)
})