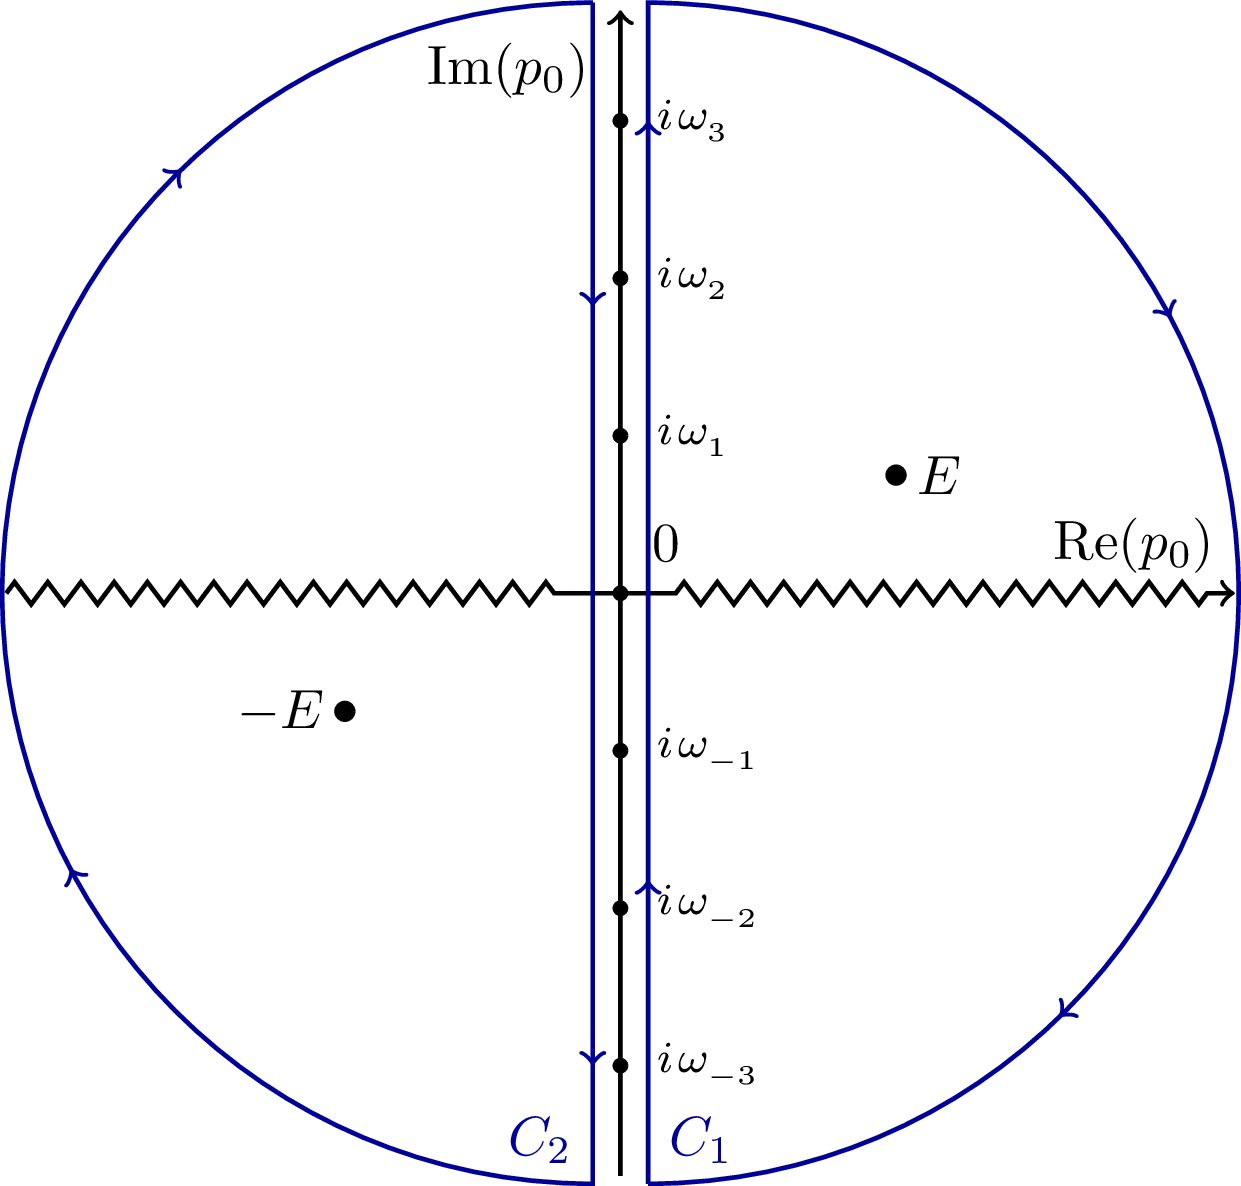
Integration contours used to evaluate bosonic Matsubara frequency sums in thermal field theory. The diagram shows contours C₁ and C₂ (enclosing the complex plane except an infinitesimal slice along the imaginary axis where the Matsubara frequencies lie). This contour deformation technique converts discrete frequency sums into continuous complex integrals via the residue theorem.
\documentclass[tikz]{standalone}
\usepackage{mathtools}
\let\Im\relax
\DeclareMathOperator{\Im}{Im}
\let\Re\relax
\DeclareMathOperator{\Re}{Re}
\usetikzlibrary{decorations.markings,positioning,decorations.pathmorphing}
\begin{document}
\begin{tikzpicture}[thick]
\def\xr{3.5} \def\yr{3}
% Axes
\draw [decorate,decoration={zigzag,segment length=6,amplitude=2,post=lineto,post length=10}] (-\xr-0.4,0) -- (0,0);
\draw [->,decorate,decoration={zigzag,segment length=6,amplitude=2,pre=lineto,pre length=10,post=lineto,post length=3}] (0,0) -- (\xr+0.4,0) node [above left] {$\Re(p_0)$};
\draw [->] (0,-\yr-0.7) -- (0,\yr+0.7) node[below left=0.1] {$\Im(p_0)$};
% Matsubara frequencies
\foreach \n in {-\yr,...,-1,1,2,...,\yr}{%
\draw[fill] (0,\n) circle (1pt) node [right=0.1,font=\footnotesize] {$i \mkern2mu \omega_{_{\n}}$};}
\draw[fill] (0,0) circle (1pt) node [above right=0.1] {0};
% Right contour line
\draw[xshift=5,blue!60!black,decoration={markings,mark=between positions 0.1 and 1 step 0.25 with \arrow{>}},postaction={decorate}] (0,-\yr-0.75) node [above right] {$C_1$} -- (0,\yr+0.75) arc (90:-90:\yr+0.75);
% Left contour line
\draw[xshift=-5,blue!60!black,decoration={markings,mark=between positions 0.1 and 1 step 0.25 with \arrow{>}},postaction={decorate}] (0,\yr+0.75) -- (0,-\yr-0.75) node [above left] {$C_2$} arc (270:90:\yr+0.75);
% Poles
\draw[fill] (\xr/2,\yr/4) circle (1.5pt) node [right] {$E$};
\draw[fill] (-\xr/2,-\yr/4) circle (1.5pt) node [left] {$-E$};
\end{tikzpicture}
\end{document}
#import "@preview/cetz:0.3.4": canvas, draw, decorations
#import draw: line, content, circle, arc, set-style, bezier
#set page(width: auto, height: auto, margin: 8pt)
// Constants
#let x-range = 3.5
#let y-range = 3
#let main-radius = y-range + 0.75
#let y-offset = 0.25
#let dot-radius = 0.05
#let small-dot-radius = 0.03
#let zigzag-start = 0.5
// Styles
#let arrow-style = (mark: (end: "stealth", scale: 0.5, fill: black))
#let dark-blue = blue.darken(20%)
#let marc-style = (symbol: "stealth", fill: dark-blue, scale: 0.5, shorten-to: none)
#let contour-style = (paint: dark-blue, thickness: 0.8pt)
#let zigzag-style = (amplitude: 0.15, segment-length: 0.25)
// Helper function to draw a semicircle with arrows
#let draw-semicircle(center-x, start-angle, end-angle, name) = {
arc(
(center-x, 0),
radius: main-radius,
start: start-angle,
stop: end-angle,
stroke: contour-style,
mark: (
end: (
(pos: 25%, ..marc-style),
(pos: 50%, ..marc-style),
(pos: 75%, ..marc-style),
),
),
name: name,
anchor: "origin",
)
}
// Helper function to draw a vertical line with arrows
#let draw-vertical-line(x, start-y, end-y, name) = {
line(
(x, start-y),
(x, end-y),
stroke: contour-style,
mark: (
end: (
(pos: 25%, ..marc-style),
(pos: 50%, ..marc-style),
(pos: 75%, ..marc-style),
),
),
name: name,
)
}
// Helper function to draw zigzag line
#let draw-zigzag(start, end, segments: 6, amplitude: 0.1, name: none) = {
let dx = end.at(0) - start.at(0)
let dy = end.at(1) - start.at(1)
let length = calc.sqrt(dx * dx + dy * dy)
let segment-length = length / segments
let points = ()
for i in range(segments + 1) {
let t = i / segments
let x = start.at(0) + dx * t
let y = start.at(1) + dy * t
// Add zigzag effect
if i > 0 and i < segments {
if calc.rem(i, 2) == 1 {
y += amplitude
} else {
y -= amplitude
}
}
points.push((x, y))
}
// Draw the zigzag line as a series of connected lines
for i in range(segments) {
line(
points.at(i),
points.at(i + 1),
stroke: (thickness: 0.8pt),
name: if name != none and i == 0 { name } else { none },
)
}
}
#canvas({
// Calculate the exact point where the x-axis intersects the right arc
// For a circle centered at (y-offset, 0) with radius main-radius,
// the x-coordinate where y=0 intersects is y-offset + main-radius
let arc_intersection = y-offset + main-radius
// Draw x-axis with zigzag on both sides
// Center straight segment
line((-zigzag-start, 0), (zigzag-start, 0), stroke: 0.8pt, name: "x-axis-center")
// Left side zigzag
decorations.zigzag(
line((-x-range - 0.4, 0), (-zigzag-start, 0)),
..zigzag-style,
stroke: 0.8pt,
name: "x-axis-left",
)
// Right side zigzag with straight end segment
// First the zigzag part - ending a bit earlier
decorations.zigzag(
line((zigzag-start, 0), (arc_intersection - 0.4, 0)),
..zigzag-style,
stroke: 0.8pt,
name: "x-axis-right-zigzag",
)
// Then the straight arrow part that touches the arc - extending to exactly touch the arc
line(
(arc_intersection - 0.4, 0),
(arc_intersection, 0),
stroke: 0.8pt,
..arrow-style,
name: "x-axis-right-arrow",
)
content("x-axis-right-arrow.end", $"Re"(p_0)$, anchor: "south-east", padding: 2pt)
// Draw y-axis
line((0, -y-range - 0.7), (0, y-range + 0.7), ..arrow-style, name: "y-axis")
content("y-axis.97%", $"Im"(p_0)$, anchor: "north-east", padding: (right: 8pt))
// Draw Matsubara frequencies
for n in range(-y-range, y-range + 1) {
if n != 0 {
circle((0, n), radius: small-dot-radius, fill: black, name: "freq-" + str(n))
content(
"freq-" + str(n),
$i omega_#text(size: 0.7em)[#n]$,
anchor: "west",
padding: (left: 10pt),
)
}
}
// Draw origin
circle((0, 0), radius: small-dot-radius, fill: black, name: "origin")
content("origin", [0], anchor: "north-east", padding: 2pt)
// Draw split contour
// Right half (C₁): vertical line down + right semicircle
draw-vertical-line(y-offset, main-radius, -main-radius, "right-line")
draw-semicircle(y-offset, -90deg, 90deg, "right-arc")
// Left half (C₂): vertical line up + left semicircle
draw-vertical-line(-y-offset, -main-radius, main-radius, "left-line")
draw-semicircle(-y-offset, 90deg, 270deg, "left-arc")
// Add contour labels
content("right-line.end", text(fill: dark-blue)[$C_1$], anchor: "south-west", padding: 4pt)
content("left-line.start", text(fill: dark-blue)[$C_2$], anchor: "south-east", padding: 4pt)
// Draw poles
circle((x-range / 2, y-range / 4), radius: dot-radius, fill: black, name: "pole-e")
content("pole-e", $E$, anchor: "west", padding: 2pt)
circle((-x-range / 2, -y-range / 4), radius: dot-radius, fill: black, name: "pole-minus-e")
content("pole-minus-e", $-E$, anchor: "east", padding: 2pt)
})