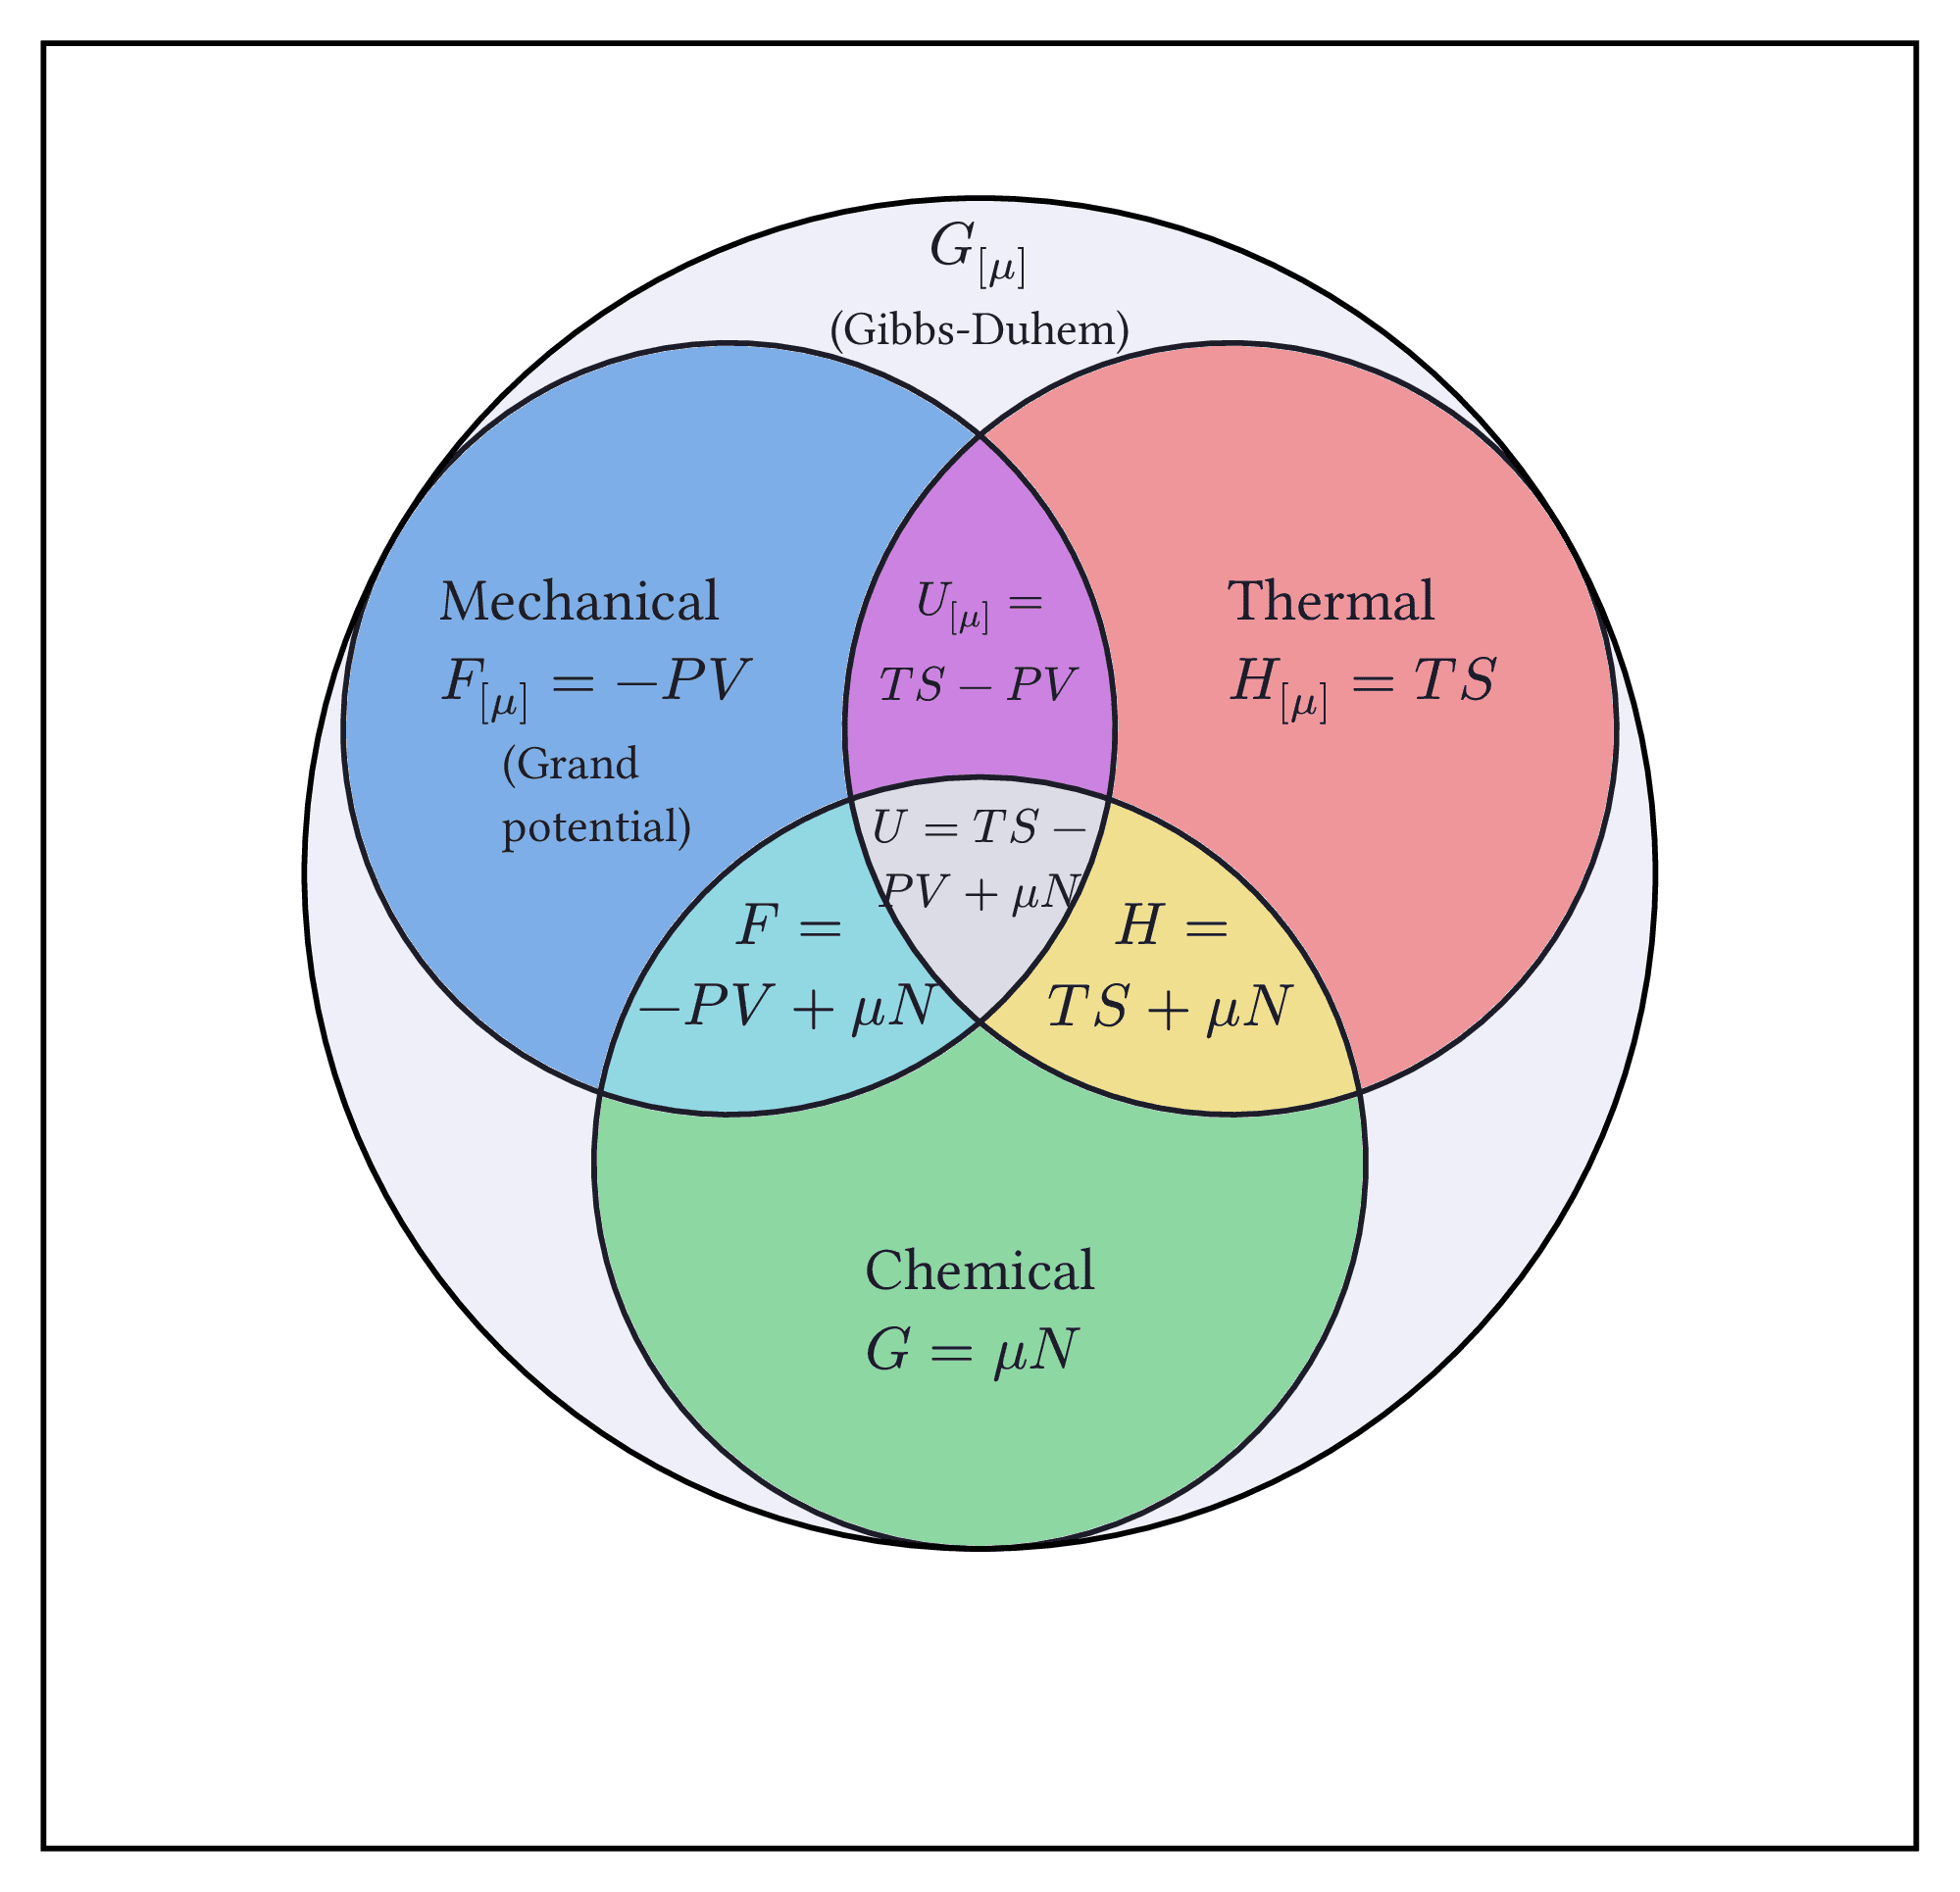
Thermodynamic Potentials Venn Diagram
A Venn diagram illustrating the relationships between thermodynamic potentials, forces, and flows. The diagram shows three main regions (Mechanical, Thermal, Chemical) and their intersections, representing different thermodynamic potentials. The subscript μ denotes an N-to-μ Legendre transform of the indicated potential (U, H, F, or G). The diagram helps visualize how different thermodynamic quantities are related through Legendre transforms.

Download
Code
thermodynamic-potentials-venn-diagram.typ (45 lines)