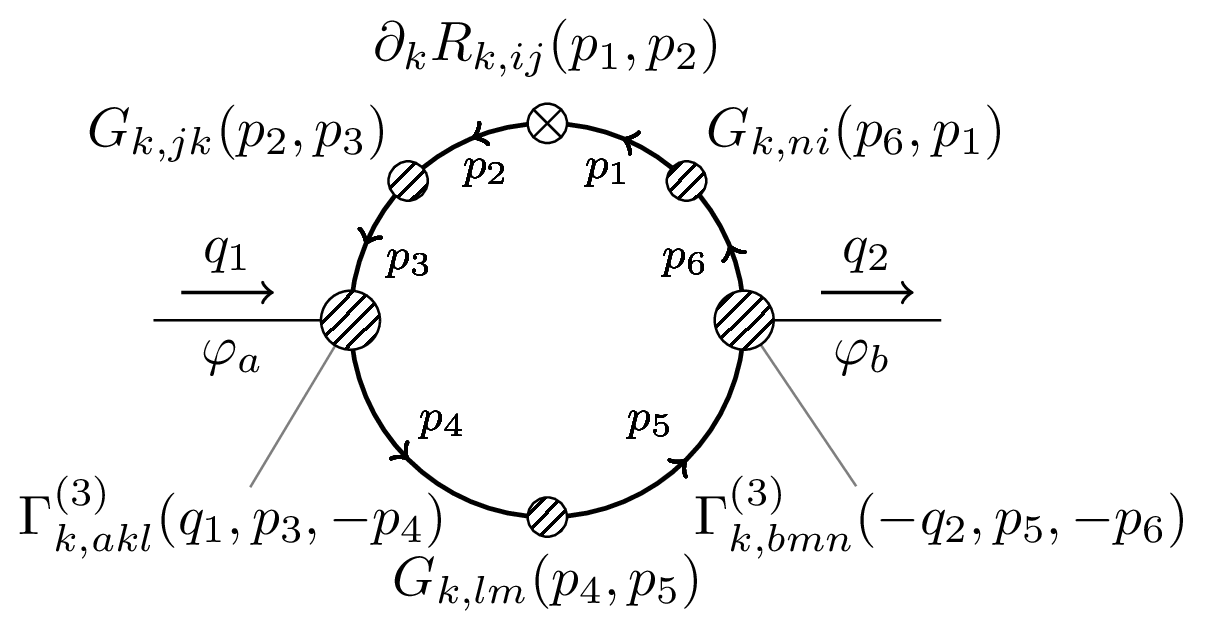
Two-point Propagator Flow
Feynman diagrams showing the flow equation for the two-point correlation function in the functional renormalization group (FRG) approach. These diagrams represent the right-hand side of the Wetterich equation for the two-point function, consisting of one-loop diagrams with a regulator insertion (cross) and dressed vertices (hatched circles). The diagrams capture quantum fluctuations at different momentum scales, important for understanding how correlation functions evolve as the energy scale changes in quantum field theories.

Download
Code
two-point-propagator-flow.typ (399 lines)
two-point-propagator-flow.tex (85 lines)