Geometric Bayes
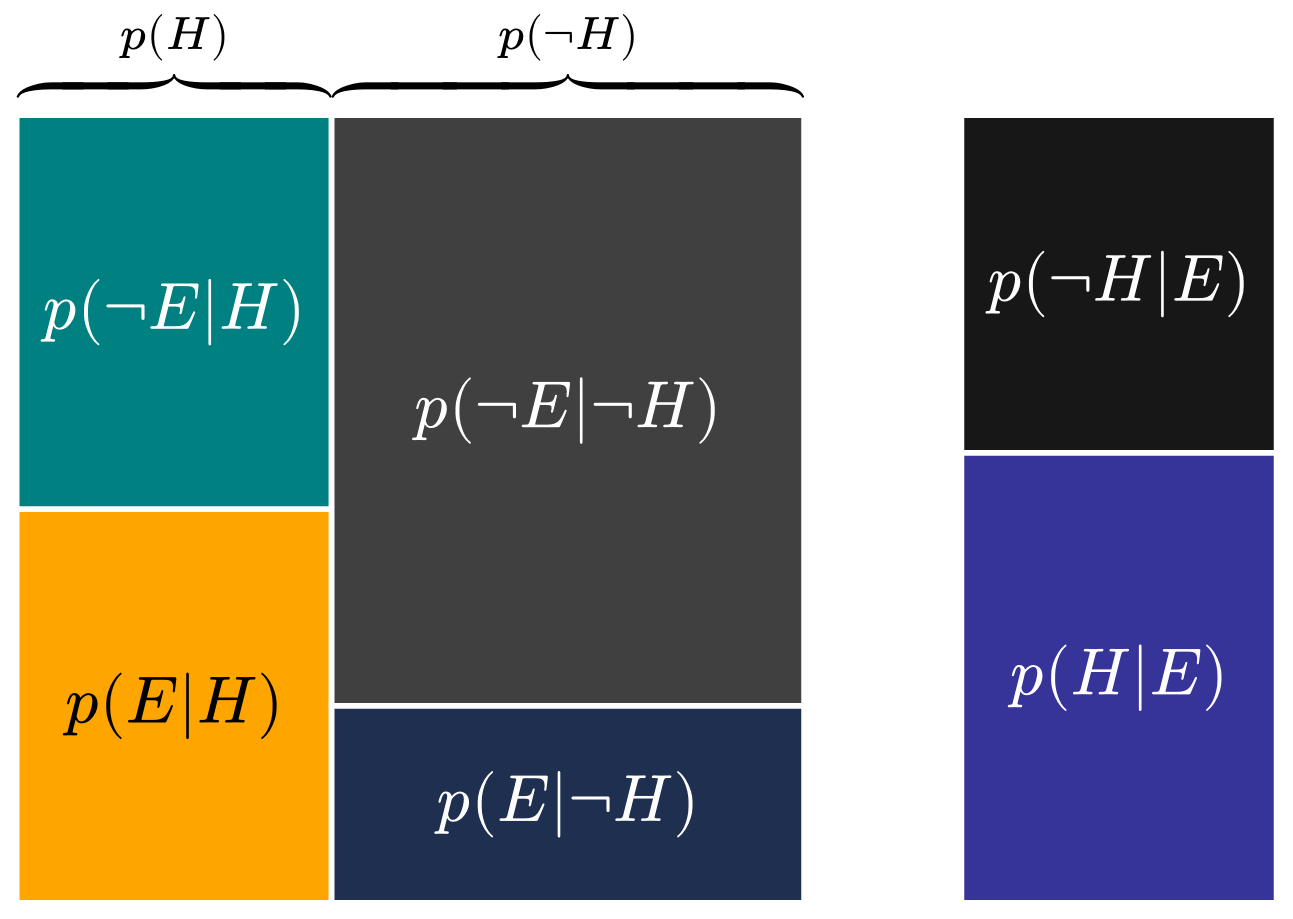
Bayes' theorem as an argument about areas. The rectangle is the whole probability space, divided into columns by the prior against and each column into rows by the likelihoods, so each of the four cells is a joint probability. Conditioning on the evidence keeps only the two cells where occurred; renormalizing their areas to sum to one gives the posterior shown in the bar on the right (here for , , ). Following 3blue1brown.
Download
Code
#import "@preview/cetz:0.5.3": canvas, draw
#import draw: content, rect

// Prior columns p(H) | p(not H) span [0, prior-end]; the posterior bar sits after a gap.
#let (mid-x, prior-end, right-x) = (2, 5, 6)
#let (likelihood-h, likelihood-not-h) = (1 / 2, 1 / 4) // p(E|H), p(E|not H)
#let prior = mid-x / prior-end
#let posterior = prior * likelihood-h / (prior * likelihood-h + (1 - prior) * likelihood-not-h)

#set page(width: auto, height: auto, margin: 3pt, fill: none)
#set text(size: 12pt, fill: white)

// White text on orange is only 2:1, so that cell gets black text.
#let orange = rgb("#FFA500")

#canvas({
  let (width, height) = (8, 5)

  for (start, end, fill, label) in (
    ((0, 0), (mid-x, likelihood-h * height), orange, $p(E|H)$),
    ((0, likelihood-h * height), (mid-x, height), rgb("#008080"), $p(not E|H)$),
    ((mid-x, 0), (prior-end, likelihood-not-h * height), rgb("#1E2F4F"), $p(E|not H)$),
    ((mid-x, likelihood-not-h * height), (prior-end, height), rgb("#404040"), $p(not E|not H)$),
    ((right-x, 0), (width, posterior * height), rgb("#363399"), $p(H|E)$),
    ((right-x, posterior * height), (width, height), rgb("#171717"), $p(not H|E)$),
  ) {
    rect(start, end, fill: fill, stroke: white, name: "cell")
    content("cell", text(fill: if fill == orange { black } else { white }, label))
  }

  for (start, end, label) in ((0, mid-x, $p(H)$), (mid-x, prior-end, $p(not H)$)) {
    content(
      ((start + end) / 2, height),
      text(fill: black, math.overbrace(box(width: (end - start) * 1cm), label)),
      padding: (5pt, 0, 15pt),
    )
  }
})