Grand Canonical Occupation Fluctuations
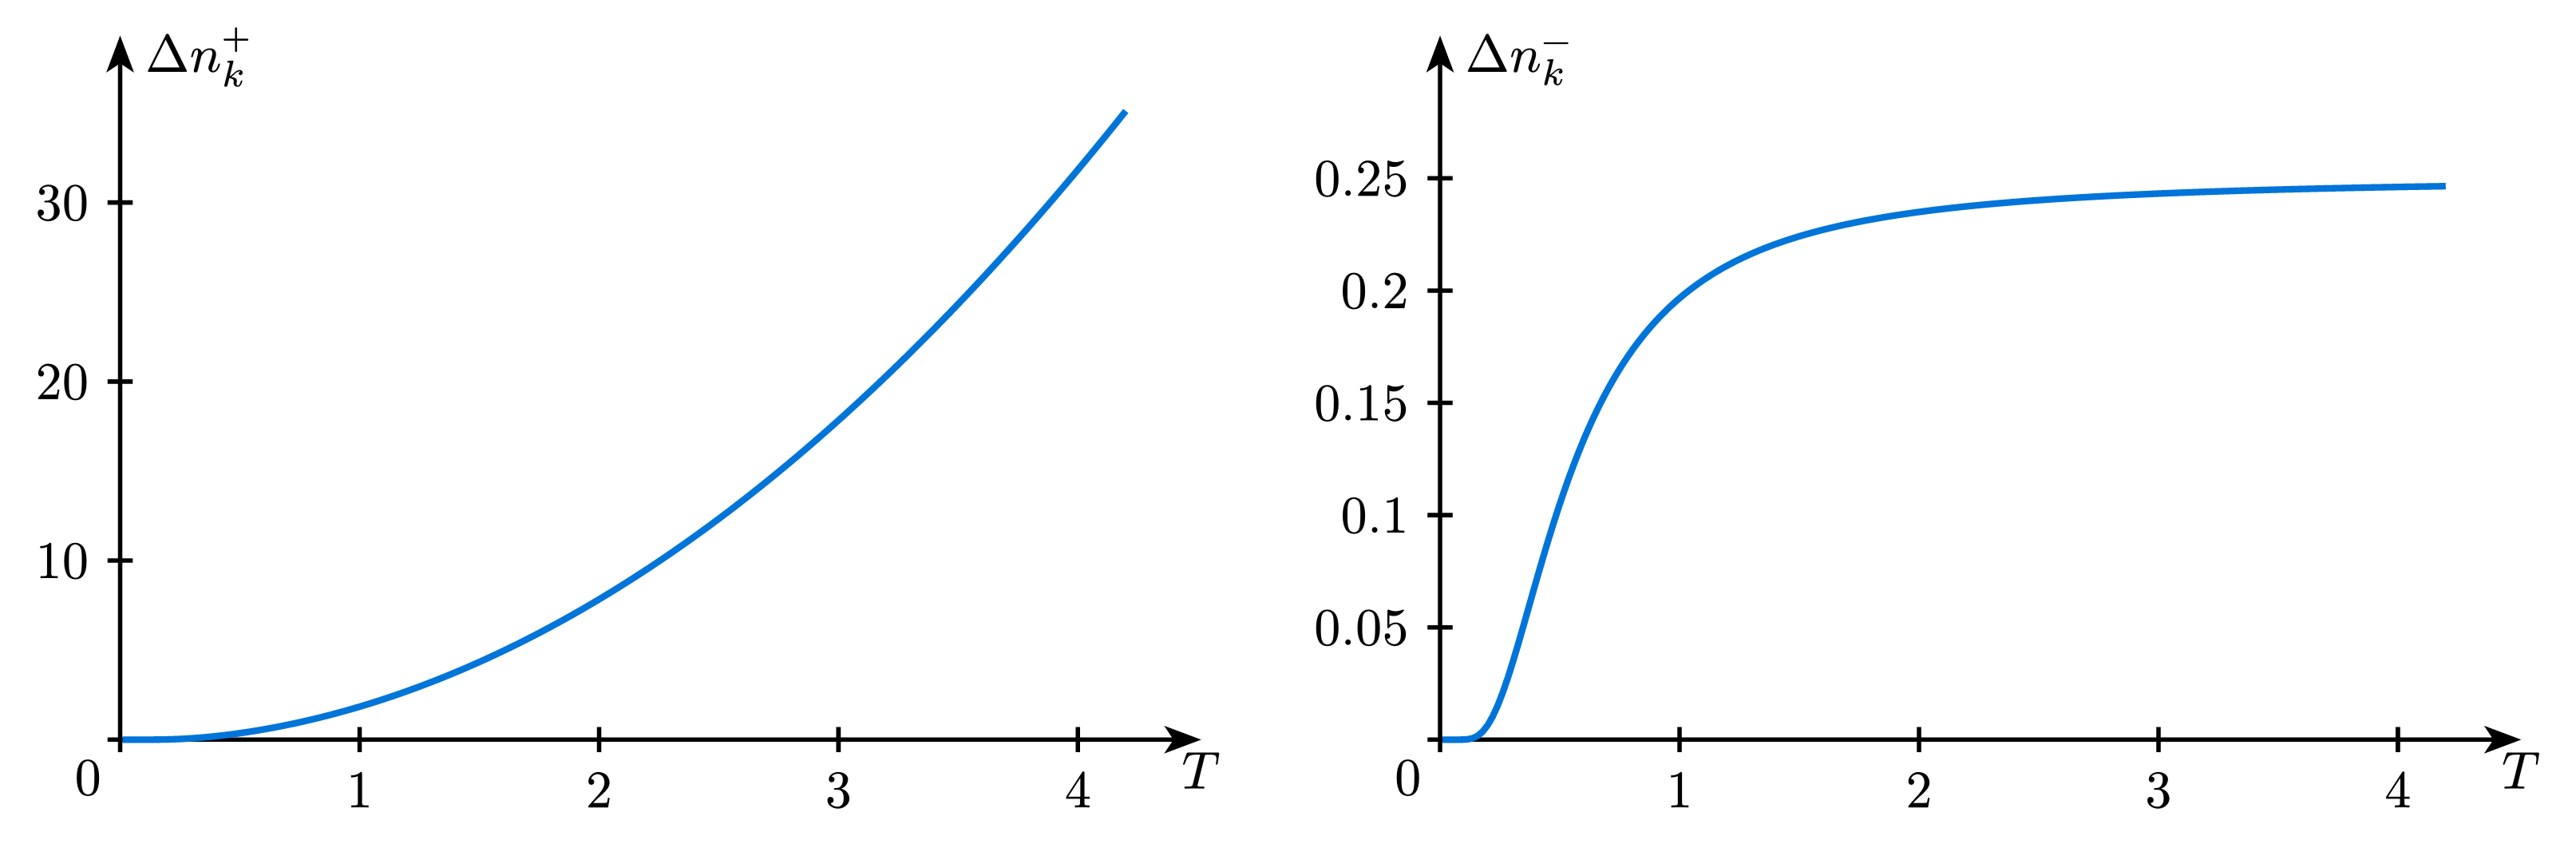
Number fluctuations of the occupation probability〈nk〉of a single mode k in an ideal Bose and Fermi gas in the grand canonical ensemble. Used in Exercise Sheet 11 of Statistical Physics by Manfred Salmhofer (2016), available at https://janosh.dev/physics/statistical-physics.
Download
Code
grand-canonical-occupation-fluctuations.typ (48 lines)
#import "@preview/cetz:0.5.2": canvas, draw
#import "@preview/cetz-plot:0.1.4": plot

#set page(width: auto, height: auto, margin: 8pt, fill: none)
#set text(size: 12pt)

#let size = (8, 5)

#canvas({
  let axis-mark = (end: "stealth", fill: black)
  draw.set-style(axes: (
    x: (mark: axis-mark, label: (anchor: "north", offset: 0.1)),
    y: (mark: axis-mark, label: (anchor: "north-west", offset: -0.2)),
  ))

  let fluctuation-plot(statistics, y-label, y-tick-step, name, y-max: auto) = plot.plot(
    size: size,
    x-min: 0,
    x-max: 4.2,
    y-min: 0,
    y-max: y-max,
    x-label: $T$,
    y-label: y-label,
    x-tick-step: 1,
    y-tick-step: y-tick-step,
    axis-style: "left",
    name: name,
    plot.add(
      style: (stroke: blue + 1.5pt),
      domain: (0.01, 4.2), // avoid T = 0
      samples: 200,
      x => {
        let beta = 1 / x
        if statistics == "bose" {
          let sinh-term = calc.sinh(beta / 2)
          1 / (2 * sinh-term * sinh-term)
        } else {
          1 / (2 + 2 * calc.cosh(beta))
        }
      },
    ),
  )

  fluctuation-plot("bose", $Delta n_k^+$, 10, "bose-plot")
  draw.translate((size.at(0) + 2.5, 0))
  fluctuation-plot("fermi", $Delta n_k^-$, 0.05, "fermi-plot", y-max: 0.28)
})