k-Nearest Neighbors
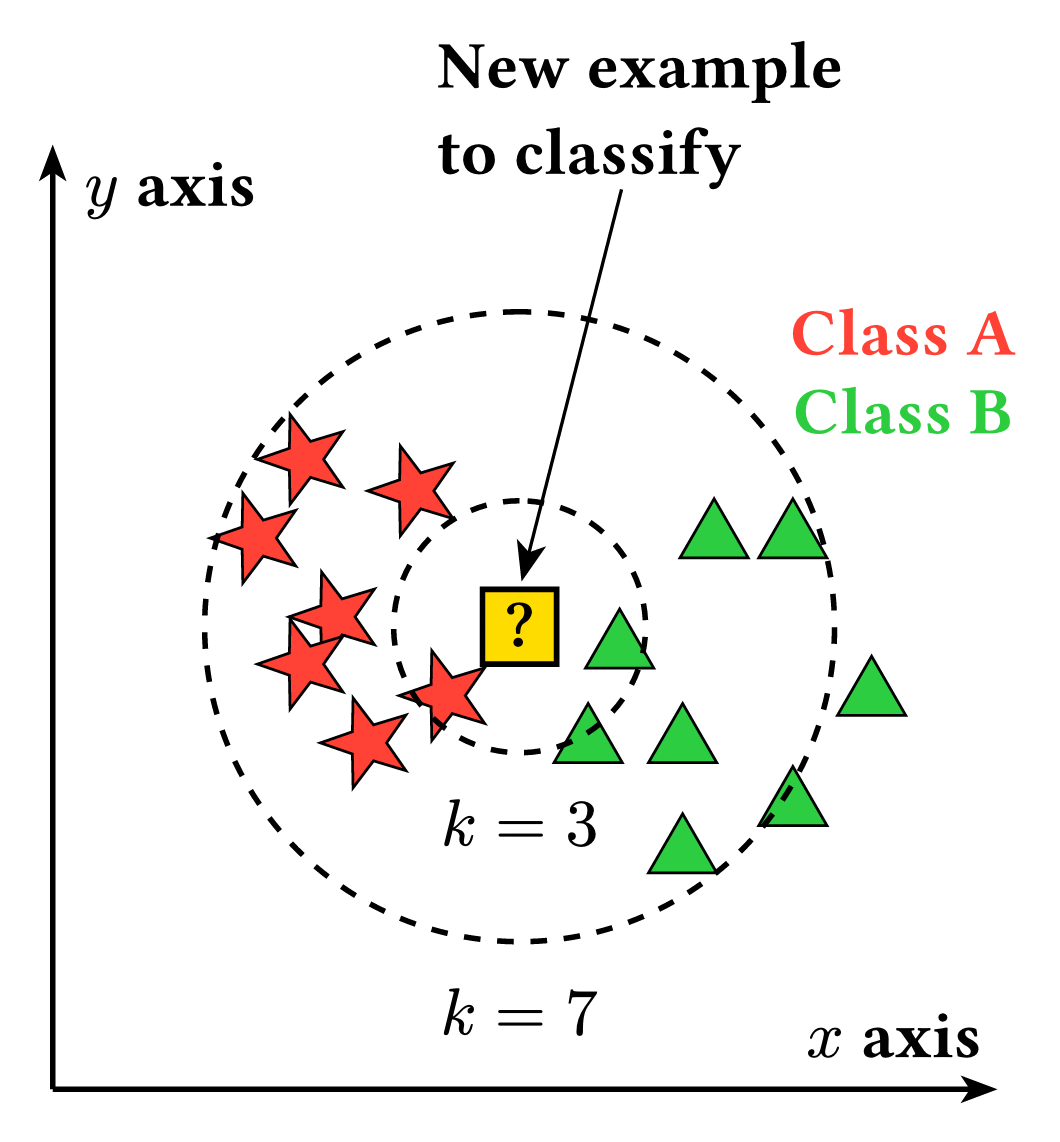
This image illustrates the K-Nearest Neighbors classification algorithm, showing how different values of affect classification results. Red stars represent Class A data points, green triangles represent Class B data points, and the yellow square with a question mark is a new instance to be classified. The dashed circles show the and neighborhoods around the instance.
Download
Code
k-nearest-neighbors.typ (90 lines)
#import "@preview/cetz:0.5.2": canvas, draw
#import draw: circle, content, line, n-star, polygon

#set page(width: auto, height: auto, margin: 8pt, fill: none)
#set text(size: 12pt, weight: "bold")

#let draw-star(pos, size: 0.3, fill: red) = {
  n-star(pos, 5, radius: size, inner-radius: .4 * size, fill: fill, stroke: .5pt, show-inner: false)
}

#let triangle(pos, fill: green) = {
  polygon(
    pos,
    3,
    radius: 0.25,
    angle: 90deg, // Point up
    fill: fill,
    stroke: .5pt,
  )
}

#canvas({
  // Set up coordinate system
  let arrow-style = (mark: (end: "stealth", fill: black, scale: 0.7))
  let axis-length = 6

  for (end, name, label, rel, anchor) in (
    ((axis-length, 0), "x-axis", [$x$ axis], (-0.1, 0.2), "south-east"),
    ((0, axis-length), "y-axis", [$y$ axis], (0.2, -0.1), "north-west"),
  ) {
    line((0, 0), end, ..arrow-style, name: name)
    content((rel: rel, to: name + ".end"), label, anchor: anchor)
  }

  for pos in ((1.6, 4.0), (1.3, 3.5), (2.3, 3.8), (1.8, 3.0), (1.6, 2.7), (2.5, 2.5), (2, 2.2)) {
    draw-star(pos)
  }
  for pos in (
    (4.2, 3.5),
    (3.6, 2.8),
    (3.4, 2.2),
    (4.0, 2.2),
    (5.2, 2.5),
    (4.7, 3.5),
    (4, 1.5),
    (4.7, 1.8),
  ) {
    triangle(pos)
  }

  // Draw the new example to classify (yellow square with question mark)
  content(
    (3, 2.5),
    (rel: (0.4, 0.4)),
    align(center, text(baseline: 1.5pt)[?]),
    anchor: "center",
    frame: "rect",
    fill: yellow,
    padding: 1pt,
    name: "new-example",
  )

  for (neighbors, radius) in ((3, 0.8), (7, 2.0)) {
    let name = "k" + str(neighbors) + "-circle"
    circle("new-example.center", radius: radius, stroke: (dash: "dashed"), name: name)
    content((rel: (0, -0.3), to: name + ".south"), $k = #neighbors$, anchor: "north")
  }

  content(
    (rel: (-.6, 4.8), to: "x-axis.end"),
    text(fill: red, size: 12pt)[Class A],
    name: "class-a-label",
  )
  content((rel: (0, -.5), to: "class-a-label"), text(
    fill: green,
    size: 12pt,
  )[Class B])

  content(
    (rel: (1, 3), to: "new-example"),
    [New example\ to classify],
    name: "new-example-label",
  )
  line("new-example-label", "new-example.north", stroke: 0.6pt, mark: (
    end: "stealth",
    fill: black,
    offset: 0.05,
  ))
})