Materials Informatics
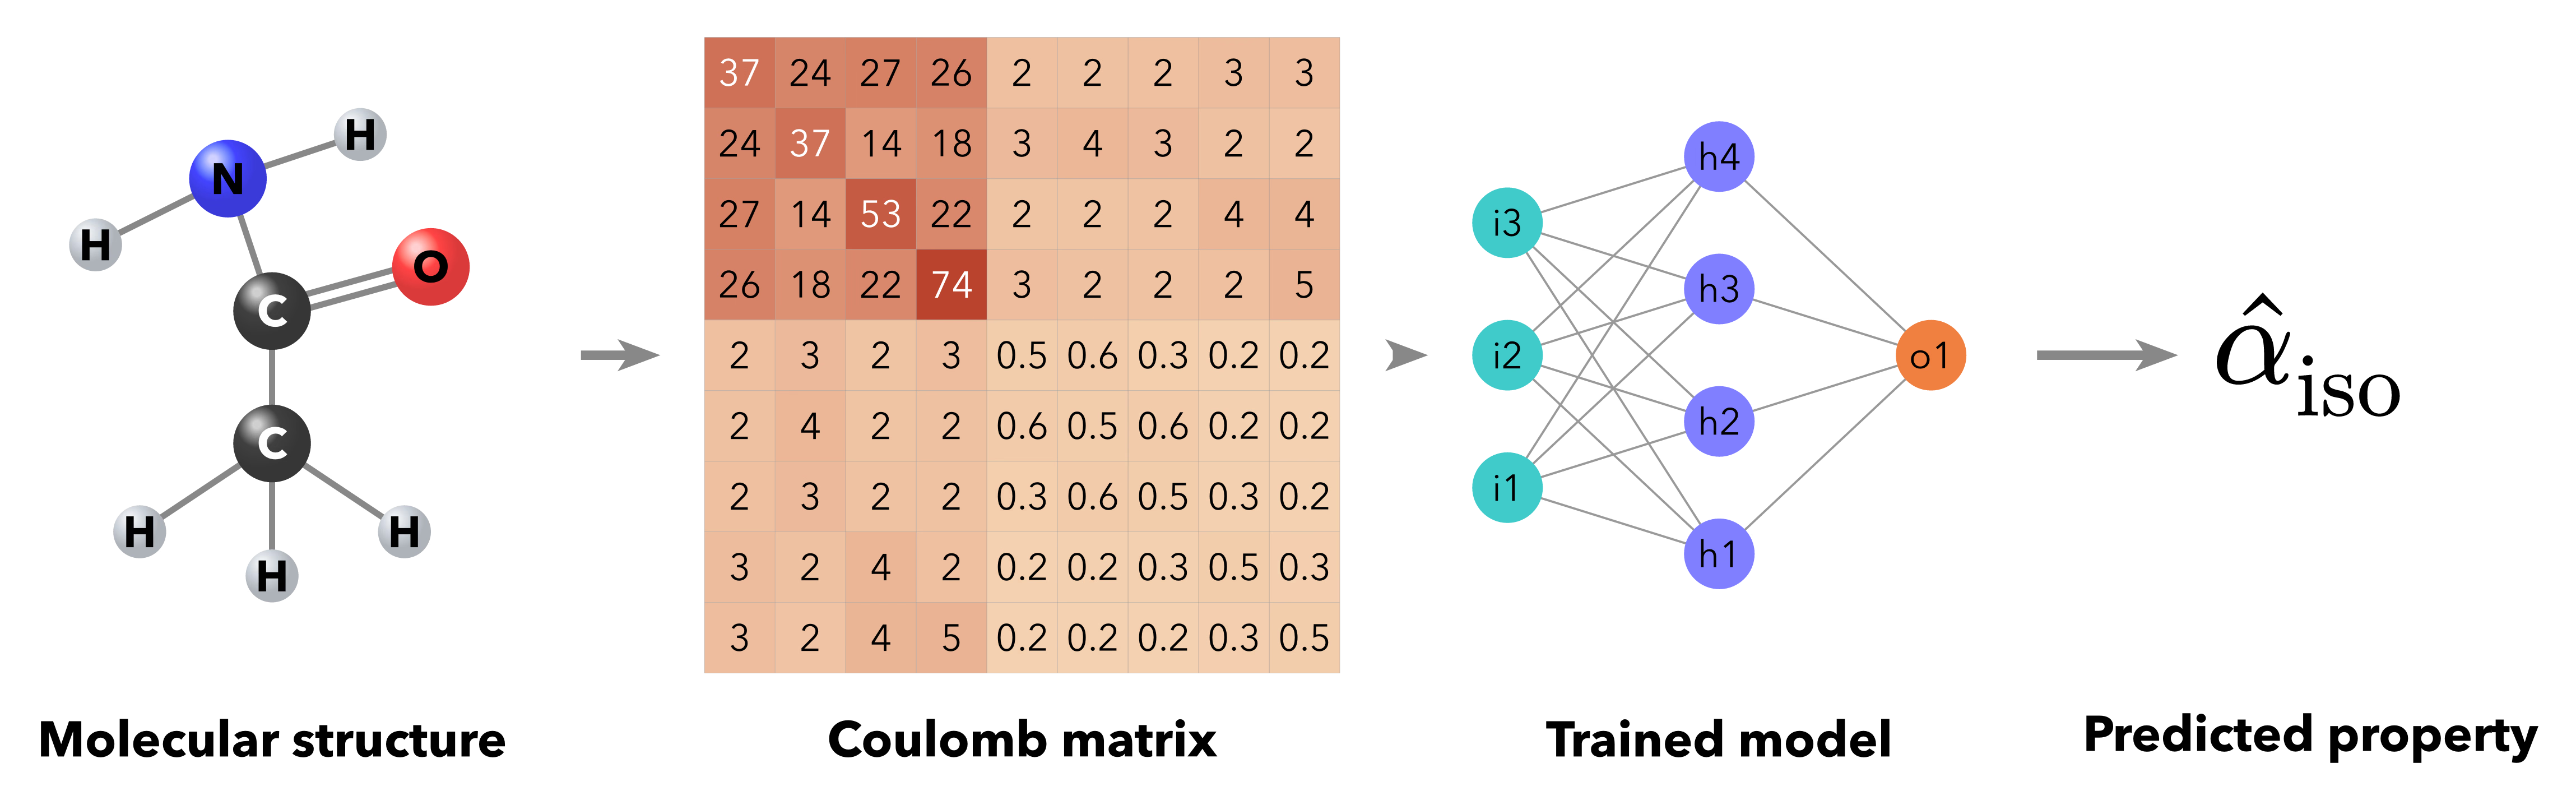
A visual structure-to-property workflow: an acetamide molecule becomes a Coulomb-matrix heatmap, a trained model maps that representation to a predicted property, and the output shown is isotropic polarizability. The molecule includes its carbonyl double bond. The network is schematic; its drawn node counts do not specify the actual input dimensions or architecture. The workflow was inspired by this Computer Physics Communications paper.
The heatmap is computed from the nine atoms in the drawing, using the Coulomb-matrix definition: diagonal entries encode nuclear charge and off-diagonal entries encode charge products divided by distance. Darker cells represent larger values, with square-root color scaling to reveal small entries. These are illustrative drawing coordinates, not an optimized three-dimensional geometry or physical descriptor values. Real inputs require physical coordinates and consistent units. The raw matrix is invariant to translation and rotation, but its rows and columns change under atom reindexing; a model needs an explicit strategy for atom permutations.
Data: record units, calculation settings, provenance, and versions; deduplicate structures and group train/test splits by the intended generalization task. Representation: scalar targets should respect translation, rotation, and permutation invariance; vector and tensor targets require the appropriate equivariance. Evaluation: hold out chemical families or physical regimes, calibrate uncertainty when provided, compare useful baselines, and check physical constraints. Report reproducibility, inference cost, and the validated domain. Choose the property and acceptable error before choosing a model. These checks retain the practical guidance from the former Materials Informatics Challenges entry without crowding the illustration.
Download
Code
materials-informatics.typ (147 lines)
#import "@preview/cetz:0.5.2": canvas, draw, vector
#import draw: circle, content, line, rect

#set page(width: auto, height: auto, margin: 12pt, fill: none)
#set text(font: "Avenir Next", size: 14pt)

// Acetamide connectivity. Positions are an illustrative sketch, not optimized geometry.
#let atoms = (
  (element: "C", charge: 6, pos: (0, 0)),
  (element: "C", charge: 6, pos: (0, -1.5)),
  (element: "N", charge: 7, pos: (-0.5, 1.5)),
  (element: "O", charge: 8, pos: (1.8, 0.5)),
  (element: "H", charge: 1, pos: (1.5, -2.5)),
  (element: "H", charge: 1, pos: (0, -3)),
  (element: "H", charge: 1, pos: (-1.5, -2.5)),
  (element: "H", charge: 1, pos: (-2, 0.75)),
  (element: "H", charge: 1, pos: (1, 2)),
)
#let bonds = (
  (0, 1, 1),
  (0, 2, 1),
  (0, 3, 2),
  (1, 4, 1),
  (1, 5, 1),
  (1, 6, 1),
  (2, 7, 1),
  (2, 8, 1),
)
// Colors encode a Coulomb matrix computed from the same schematic coordinates.
// A real descriptor uses physical 3D positions and consistent length units.
#let matrix = (
  atoms
    .enumerate()
    .map(((row_idx, left)) => atoms
      .enumerate()
      .map(((col_idx, right)) => {
        if row_idx == col_idx { 0.5 * calc.pow(left.charge, 2.4) } else {
          left.charge * right.charge / vector.dist(left.pos, right.pos)
        }
      }))
)
#let palette = (C: rgb("#404040"), N: rgb("#4444ff"), O: rgb("#ff4444"), H: rgb("#cdd3da"))

#canvas({
  let caption(center_x, body) = content((center_x, -4.35), text(size: 16pt, weight: "bold", body))
  let molecule_pos(pos) = (pos.at(0), pos.at(1) + 0.5)

  // Draw bonds first so atom spheres conceal the endpoints.
  for (left_idx, right_idx, order) in bonds {
    let left = molecule_pos(atoms.at(left_idx).pos)
    let right = molecule_pos(atoms.at(right_idx).pos)
    let (delta_x, delta_y) = vector.sub(right, left)
    let length = vector.dist(left, right)
    let normal = (-delta_y / length, delta_x / length)
    for strand in range(order) {
      let offset = vector.scale(normal, (strand - (order - 1) / 2) * 0.16)
      line(vector.add(left, offset), vector.add(right, offset), stroke: rgb("#888") + 2pt)
    }
  }
  for atom in atoms {
    let color = palette.at(atom.element)
    let pos = molecule_pos(atom.pos)
    circle(
      pos,
      radius: if atom.element == "H" { 0.3 } else { 0.44 },
      stroke: none,
      fill: gradient.radial(
        color.lighten(75%),
        color,
        color.darken(15%),
        focal-center: (30%, 25%),
        focal-radius: 5%,
        center: (35%, 30%),
      ),
    )
    content(pos, text(
      fill: if atom.element == "C" { white } else { black },
      weight: "bold",
      atom.element,
    ))
  }
  caption(0, [Molecular structure])

  // Rounded entries retain one decimal below one so small interactions stay visible.
  let cell_size = 0.8
  let matrix_top = atoms.len() * cell_size / 2
  let matrix_left = 8.5 - matrix_top
  let matrix_right = 8.5 + matrix_top
  let maximum = calc.max(..matrix.flatten())
  for (row_idx, row) in matrix.enumerate() {
    for (col_idx, value) in row.enumerate() {
      let intensity = calc.sqrt(value / maximum)
      let cell_left = matrix_left + col_idx * cell_size
      let cell_top = matrix_top - row_idx * cell_size
      rect(
        (cell_left, cell_top),
        (cell_left + cell_size, cell_top - cell_size),
        stroke: none,
        fill: color.mix((rgb("#f6d9b8"), 1 - intensity), (rgb("#ba432d"), intensity)),
      )
      content(
        (cell_left + cell_size / 2, cell_top - cell_size / 2),
        text(size: 12pt, fill: if intensity > 0.65 { white } else { black })[
          #calc.round(value, digits: if value < 1 { 1 } else { 0 })
        ],
      )
    }
  }
  let grid_stroke = rgb("#888").transparentize(60%) + 0.2pt
  for grid_idx in range(atoms.len() + 1) {
    let grid_x = matrix_left + grid_idx * cell_size
    let grid_y = matrix_top - grid_idx * cell_size
    line((grid_x, -matrix_top), (grid_x, matrix_top), stroke: grid_stroke)
    line((matrix_left, grid_y), (matrix_right, grid_y), stroke: grid_stroke)
  }
  caption(matrix_left + atoms.len() * cell_size / 2, [Coulomb matrix])

  // A schematic network: its displayed node counts are not input dimensions.
  let layers = (
    (center_x: 14, count: 3, prefix: "i", color: rgb("#40caca")),
    (center_x: 16.4, count: 4, prefix: "h", color: rgb("#8080ff")),
    (center_x: 18.8, count: 1, prefix: "o", color: rgb("#f08040")),
  )
  let node_pos(layer, node_idx) = (layer.center_x, (node_idx - (layer.count - 1) / 2) * 1.5)
  for (layer, next_layer) in layers.windows(2) {
    for node_idx in range(layer.count) {
      for next_idx in range(next_layer.count) {
        line(node_pos(layer, node_idx), node_pos(next_layer, next_idx), stroke: rgb("#999") + 0.7pt)
      }
    }
  }
  for layer in layers {
    for node_idx in range(layer.count) {
      circle(node_pos(layer, node_idx), radius: 0.4, fill: layer.color, stroke: none)
      content(node_pos(layer, node_idx), text(size: 12pt)[#layer.prefix#(node_idx + 1)])
    }
  }
  caption(16.4, [Trained model])

  content((23.1, 0), text(size: 42pt)[$hat(alpha)_"iso"$])
  caption(23.1, [Predicted property])

  for (start_x, end_x) in ((3.5, matrix_left - 0.5), (matrix_right + 0.6, 13.1), (20, 21.6)) {
    line((start_x, 0), (end_x, 0), stroke: rgb("#888") + 3pt, mark: (end: "stealth", size: 12pt))
  }
})