Matsubara Contours
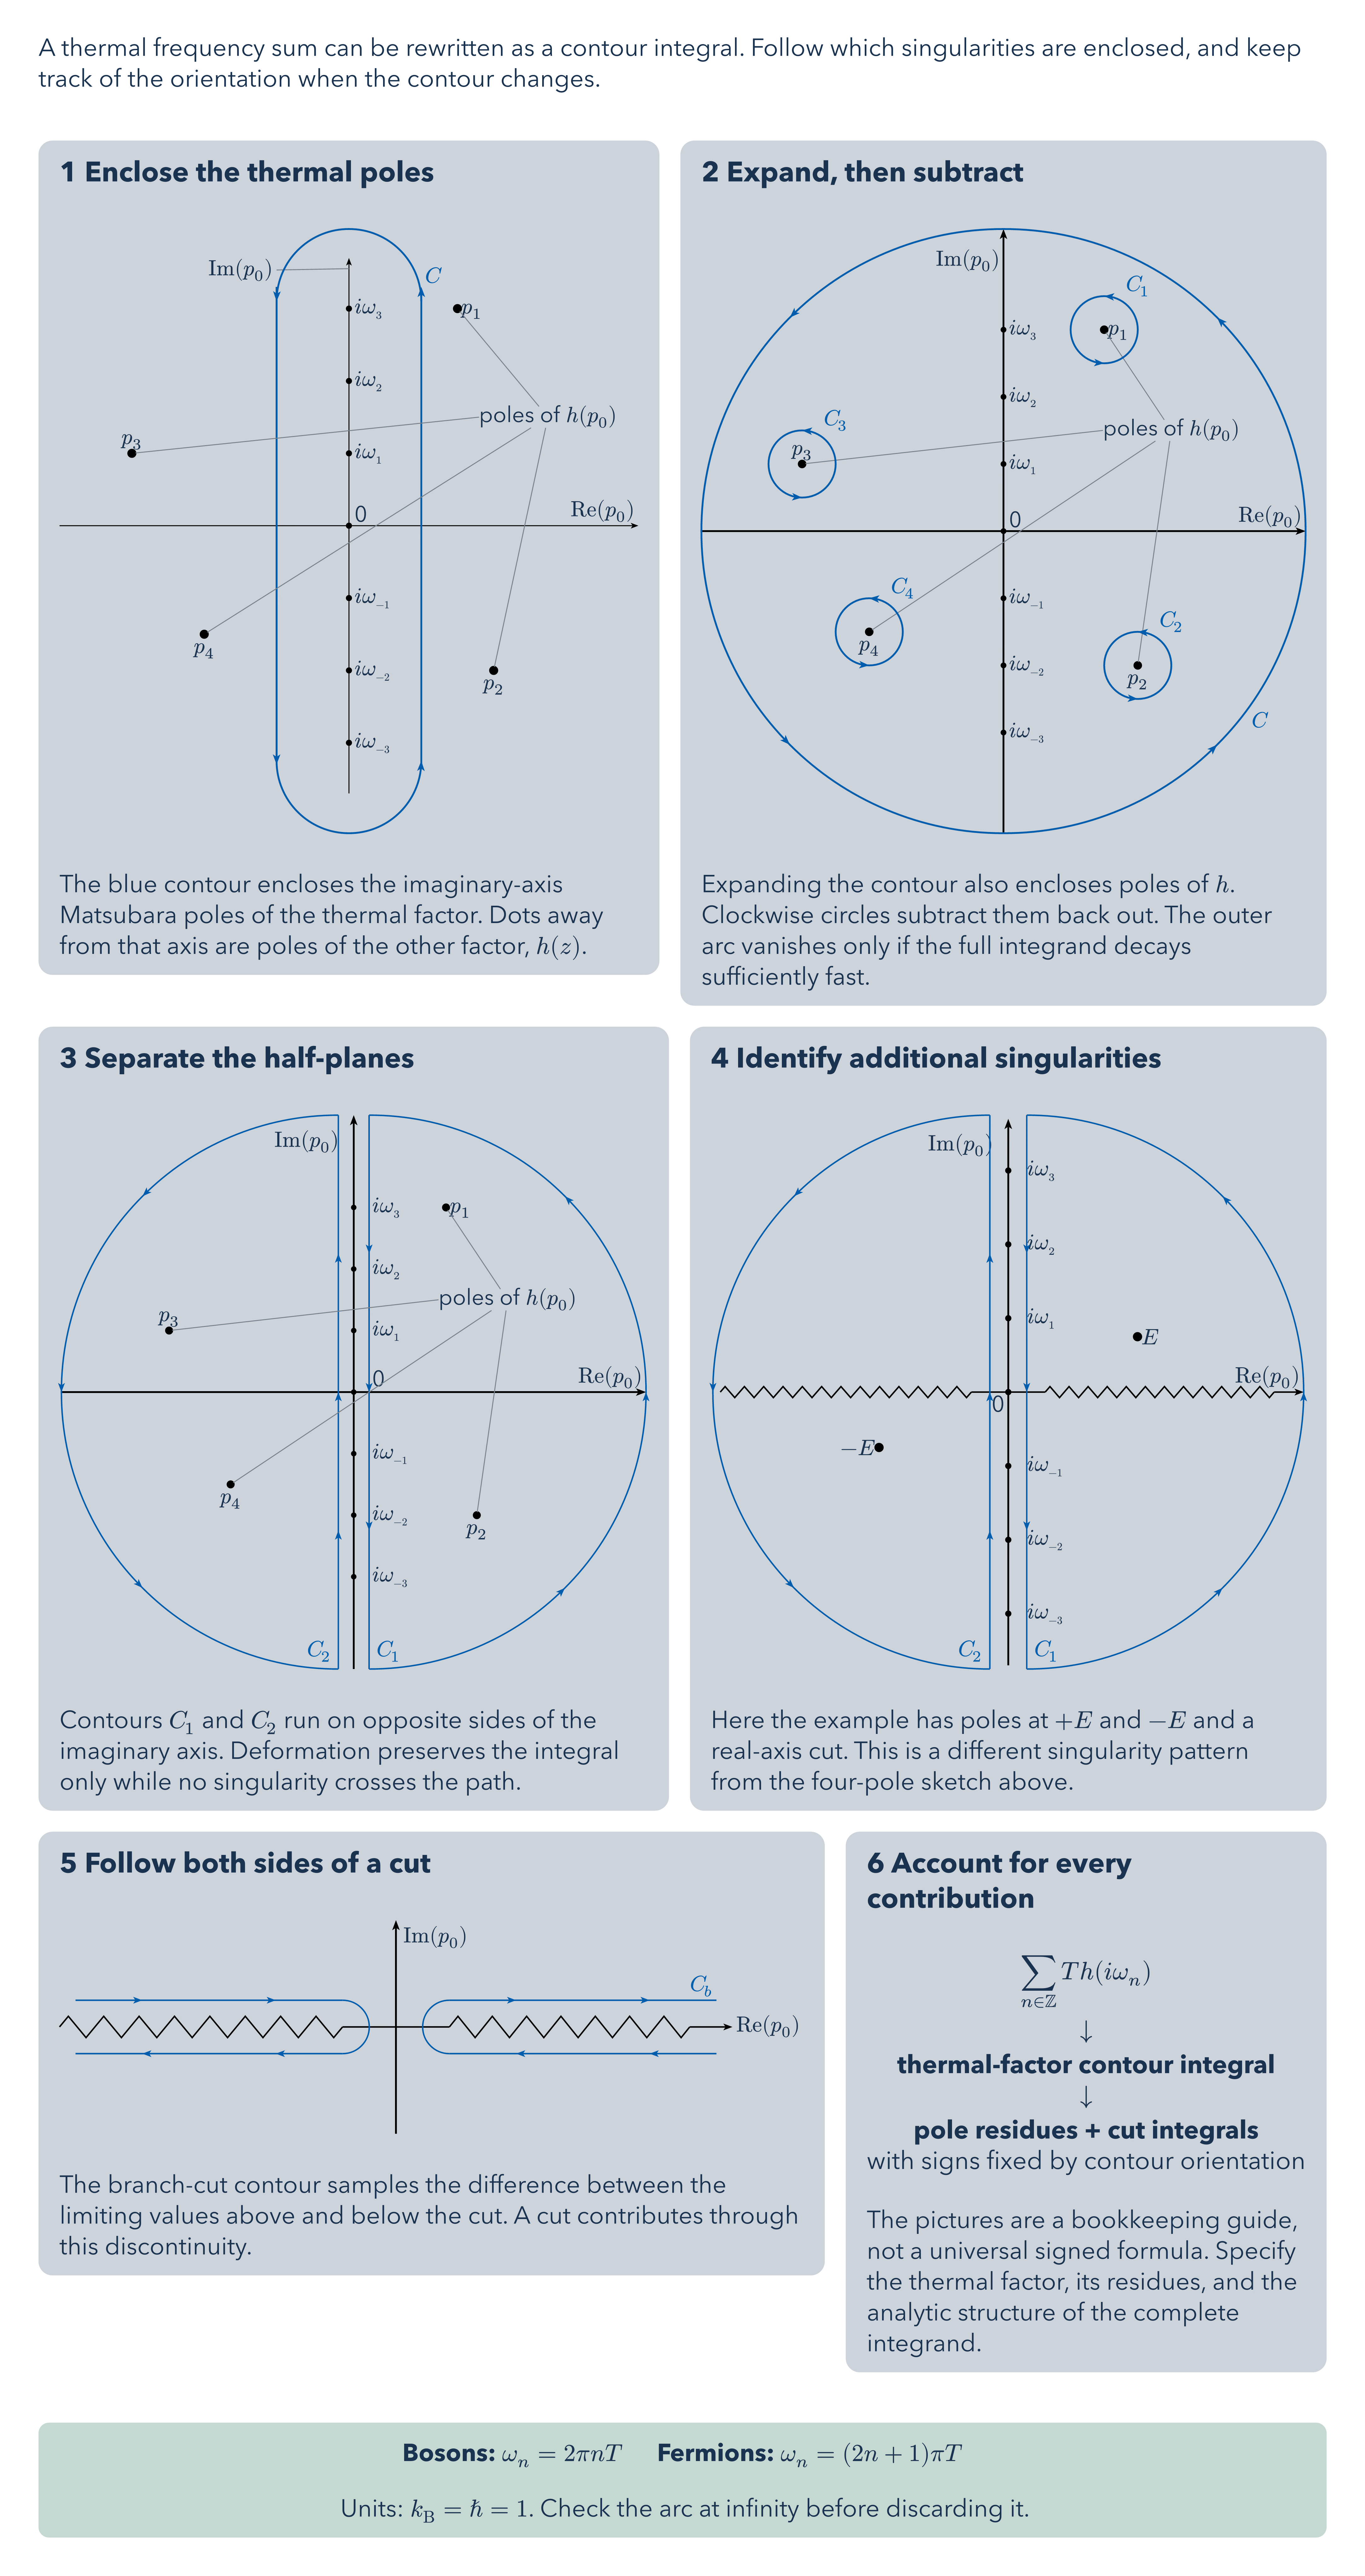
A thermal frequency sum can be rewritten as a contour integral. Follow which singularities are enclosed, and keep track of the orientation when the contour changes.
Download
Code
matsubara-contours.typ (394 lines)
#import "@preview/cetz:0.5.2": canvas, decorations, draw
#import draw: arc, circle, content, line
#let label-size = 12pt
#let paragraph-size = 14pt
#let heading-size = 16pt

#let card_body(title, body, caption) = block(
  width: 100%,
  inset: 12pt,
  radius: 8pt,
  fill: rgb("#cdd3da"),
  breakable: false,
)[
  #text(size: heading-size, weight: "bold", title)
  #v(8pt)
  // Measure unconstrained artwork before scaling, including content wider than its card.
  #layout(size => {
    let artwork = text(size: label-size, body)
    std.scale(size.width / measure(artwork).width * 100%, reflow: true, artwork)
  })
  #v(7pt)
  #text(size: paragraph-size, caption)
]

#let card-grid(columns: 2, ..cards) = layout(size => {
  let rows = cards
    .pos()
    .chunks(columns)
    .map(row => {
      let ratios = row.map(card => {
        let bounds = measure(text(size: label-size, card.at(1)))
        bounds.width / bounds.height
      })
      let available = size.width - 12pt * (row.len() - 1) - 24pt * row.len()
      grid(
        columns: ratios.map(ratio => 24pt + available * ratio / ratios.sum()),
        gutter: 12pt,
        ..row.map(args => card_body(..args)),
      )
    })
  stack(dir: ttb, spacing: 12pt, ..rows)
})

#let takeaway(body) = block(
  width: 100%,
  inset: 12pt,
  radius: 6pt,
  fill: rgb("#c6d8d2"),
  breakable: false,
  text(size: paragraph-size, body),
)

#set page(width: 780pt, height: auto, margin: 22pt, fill: none)
#set text(font: "Avenir Next", size: paragraph-size, fill: rgb("#19324f"))
#set par(leading: 0.55em)

// Hairline tying a label to whatever it names: pole callouts, semi-axis leaders,
// off-diagram vertex captions.
#let leader = (paint: rgb("#78828C"), thickness: 0.5pt)

#let axis-arrow = (mark: (end: "stealth", fill: black, scale: 0.5))

#let dark-blue = blue.darken(20%)

#let contour-stroke = (paint: dark-blue, thickness: 0.8pt)

// Arrowheads at the given fractions along a contour, marking its orientation.
#let contour-marks(..fractions) = (
  end: fractions
    .pos()
    .map(pos => (
      pos: pos,
      symbol: "stealth",
      fill: dark-blue,
      scale: 0.5,
      shorten-to: none,
    )),
)

#let thermal-poles(extent, label-padding: (x: 3pt)) = {
  // Dots on the imaginary axis at every non-zero Matsubara frequency i omega_n.
  for n in range(-extent, extent + 1).filter(n => n != 0) {
    let name = "freq-" + str(n)
    circle((0, n), radius: 0.03, fill: black, name: name)
    content(name, $i omega_#text(size: 0.7em)[#n]$, anchor: "west", padding: label-padding)
  }
  circle((0, 0), radius: 0.03, fill: black, name: "origin")
}

#let function-poles(label-pos) = {
  // Poles of h(p_0), each tied to a shared callout label by a hairline.
  content(label-pos, [poles of $h(p_0)$], name: "poles-label")
  let sites = (
    ((1.5, 3), "west"),
    ((2, -2), "north"),
    ((-3, 1), "south"),
    ((-2, -1.5), "north"),
  )
  for (idx, (pos, anchor)) in sites.enumerate(start: 1) {
    let name = "p" + str(idx)
    circle(pos, radius: 0.05, fill: black, name: name)
    content(name, $p_#idx$, anchor: anchor, padding: 2pt)
    // p3 sits far to the left, so aim its hairline at the label's west edge
    let target = if idx == 3 { "poles-label.west" } else { "poles-label" }
    line(target, name, stroke: leader)
  }
}

#let half-contours(main-radius, y-offset) = {
  // Contour split into a right half C_1 and a left half C_2, each a vertical line
  // running past the poles and closed by a semicircle at infinity.
  let style = (
    stroke: contour-stroke,
    mark: contour-marks(25%, 50%, 75%),
  )
  // C_1 runs down the right of the imaginary axis and back up its semicircle; C_2 mirrors it
  for (sign, start, label, anchor) in (
    (1, -90deg, $C_1$, "south-west"),
    (-1, 90deg, $C_2$, "south-east"),
  ) {
    let x = sign * y-offset
    line((x, sign * main-radius), (x, -sign * main-radius), ..style)
    arc(
      (x, 0),
      radius: main-radius,
      start: start,
      stop: start + 180deg,
      anchor: "origin",
      ..style,
    )
    content((x, -main-radius), text(fill: dark-blue, label), anchor: anchor, padding: 4pt)
  }
}

// Real axis drawn as a branch cut: zigzags flank the origin, with a straight arrow tip.
#let cut-axis(left, right, amplitude: 0.2, segment-length: 0.3) = {
  let (gap, tip) = (0.5, 0.4)
  let zigzag = (amplitude: amplitude, segment-length: segment-length, stroke: 0.8pt)
  line((-gap, 0), (gap, 0), stroke: 0.8pt)
  decorations.zigzag(line((left, 0), (-gap, 0)), ..zigzag)
  decorations.zigzag(line((gap, 0), (right - tip, 0)), ..zigzag)
  line((right - tip, 0), (right, 0), stroke: 0.8pt, ..axis-arrow, name: "x-axis")
}

// === 1  Enclose the thermal poles ===
#let figure-0 = [

  #let range-xy = 3
  #let axis = (..axis-arrow, stroke: 0.5pt)
  #let contour = (stroke: dark-blue, mark: (end: "stealth", scale: 0.5))

  #canvas(length: 1.39cm, {
    line((-range-xy - 1, 0), (range-xy + 1, 0), ..axis, name: "x-axis")
    content("x-axis.end", $"Re"(p_0)$, anchor: "south-east", padding: 2pt)

    line((0, -range-xy - 0.7), (0, range-xy + 0.7), ..axis, name: "y-axis")
    content(
      (rel: (-1, 0), to: "y-axis.95%"),
      $"Im"(p_0)$,
      name: "y-label",
      anchor: "south-east",
      padding: 2pt,
    )
    line("y-axis.98%", "y-label", stroke: leader)

    thermal-poles(range-xy)
    content("origin", [0], anchor: "south-west", padding: (left: 3pt, bottom: 2pt))

    // Contour C hugs the imaginary axis, closed by semicircles beyond the last frequency
    line((1, -range-xy - 0.3), (1, range-xy + 0.3), ..contour, name: "right-line")
    line((-1, range-xy + 0.3), (-1, -range-xy - 0.3), ..contour)
    arc((0, range-xy + 0.6), radius: 1, start: 0deg, stop: 180deg, anchor: "center", ..contour)
    arc((0, -range-xy - 0.5), radius: 1, start: 180deg, stop: 360deg, anchor: "center", ..contour)
    content("right-line.end", text(fill: dark-blue)[$C$], anchor: "south-west", padding: 2pt)

    function-poles((2.75, 1.5))
  })
]

// === 2  Expand, then subtract ===
#let figure-1 = [


  #let y-range = 3
  #let main-radius = y-range + 1.5
  #let axis = (mark: (end: "stealth", scale: 0.5))

  #canvas(length: 1.3cm, {
    line((-main-radius, 0), (main-radius, 0), ..axis, name: "x-axis")
    content("x-axis.end", $"Re"(p_0)$, anchor: "south-east", padding: 2pt)

    line((0, -main-radius), (0, main-radius), ..axis, name: "y-axis")
    content("y-axis.97%", $"Im"(p_0)$, anchor: "north-east", padding: 2pt)

    thermal-poles(y-range)
    content("origin", [0], anchor: "south-west", padding: (left: 3pt, bottom: 2pt))

    // Outer contour C, deformable into the four small pole contours C_1..C_4
    arc(
      (0, 0),
      radius: main-radius,
      start: 0deg,
      stop: 360deg,
      anchor: "origin",
      stroke: dark-blue,
      mark: contour-marks(12.5%, 37.5%, 62.5%, 87.5%),
      name: "main-contour",
    )
    content(
      "main-contour.90%",
      text(fill: dark-blue)[$C$],
      anchor: "north-west",
      padding: 2pt,
    )

    function-poles((2.5, 1.5))

    for idx in range(1, 5) {
      let name = "c" + str(idx)
      arc(
        "p" + str(idx),
        radius: 0.5,
        start: 0deg,
        stop: 360deg,
        anchor: "origin",
        stroke: dark-blue,
        mark: contour-marks(25%, 75%),
        name: name,
      )
      content(
        (rel: (0, 0.8), to: name),
        text(fill: dark-blue)[$C_#idx$],
        anchor: "north",
      )
    }
  })
]

// === 3  Separate the half-planes ===
#let figure-2 = [

  #let y-range = 3
  #let main-radius = y-range + 1.5
  #let y-offset = 0.25
  #let axis = (mark: (end: "stealth", scale: 0.5))

  #canvas(length: 1.18cm, {
    line(
      (-main-radius - y-offset, 0),
      (main-radius + y-offset, 0),
      ..axis,
      name: "x-axis",
    )
    content("x-axis.end", $"Re"(p_0)$, anchor: "south-east", padding: 2pt)

    line((0, -main-radius), (0, main-radius), ..axis, name: "y-axis")
    content("y-axis.97%", $"Im"(p_0)$, anchor: "north-east", padding: (right: 8pt))

    thermal-poles(y-range, label-padding: (left: 10pt))
    content("origin", [0], anchor: "south-west", padding: (left: 10pt, bottom: 3pt))
    half-contours(main-radius, y-offset)
    function-poles((2.5, 1.5))
  })
]

// === 4  Identify additional singularities ===
#let figure-3 = [

  #let (x-range, y-range) = (3.5, 3)
  #let main-radius = y-range + 0.75
  #let y-offset = 0.25

  #canvas(length: 1.4cm, {
    // Right zigzag stops where the x-axis meets the right arc.
    cut-axis(-x-range - 0.4, y-offset + main-radius, amplitude: 0.15, segment-length: 0.25)
    content("x-axis.end", $"Re"(p_0)$, anchor: "south-east", padding: 2pt)

    line((0, -y-range - 0.7), (0, y-range + 0.7), ..axis-arrow, name: "y-axis")
    content("y-axis.97%", $"Im"(p_0)$, anchor: "north-east", padding: (right: 8pt))

    thermal-poles(y-range, label-padding: (left: 10pt))
    content("origin", [0], anchor: "north-east", padding: 2pt)
    half-contours(main-radius, y-offset)

    for (name, pos, label, anchor) in (
      ("pole-e", (x-range / 2, y-range / 4), $E$, "west"),
      ("pole-minus-e", (-x-range / 2, -y-range / 4), $-E$, "east"),
    ) {
      circle(pos, radius: 0.05, fill: black, name: name)
      content(name, label, anchor: anchor, padding: 2pt)
    }
  })
]

// === 5  Follow both sides of a cut ===
#let figure-4 = [

  #let (x-range, y-range) = (3, 1)
  #let radius = y-range / 4

  #canvas(length: 2.06cm, {
    cut-axis(-1.05 * x-range, 1.05 * x-range)
    content("x-axis.end", $"Re"(p_0)$, anchor: "west", padding: 2pt)

    line((0, -y-range), (0, y-range), ..axis-arrow, name: "y-axis")
    content("y-axis.end", $"Im"(p_0)$, anchor: "north-west", padding: 4pt)

    // C_b and its point reflection: each runs in from x = ±x-range, hooks around the
    // origin on a semicircle and back out. Reflection swaps the arc's start and end.
    let leg = (start, end, ..args) => line(
      start,
      end,
      stroke: contour-stroke,
      mark: contour-marks(25%, 75%),
      ..args,
    )
    for sign in (1, -1) {
      let name = "arc" + str(sign)
      arc(
        (sign * radius, 0),
        radius: radius,
        start: 90deg + sign * 180deg,
        stop: 90deg,
        anchor: "arc-center",
        stroke: contour-stroke,
        name: name,
      )
      let (near, far) = if sign == 1 { ("start", "end") } else { ("end", "start") }
      leg((sign * x-range, -sign * radius), name + "." + near)
      leg(name + "." + far, (sign * x-range, sign * radius), name: "outflow" + str(sign))
    }

    content("outflow1.end", text(fill: dark-blue)[$C_b$], anchor: "south-east", padding: 2pt)
  })
]

// === 6  Account for every contribution ===
#let figure-5 = align(center, stack(
  dir: ttb,
  spacing: 6pt,
  $ sum_(n in ZZ) T h(i omega_n) $,
  $ arrow.b $,
  [*thermal-factor contour integral*],
  $ arrow.b $,
  [*pole residues + cut integrals*],
  text(size: label-size)[with signs fixed by contour orientation],
))

A thermal frequency sum can be rewritten as a contour integral. Follow which singularities are enclosed, and keep track of the orientation when the contour changes.
#v(14pt)
#card-grid(
  (
    [1  Enclose the thermal poles],
    figure-0,
    [The blue contour encloses the imaginary-axis Matsubara poles of the thermal factor. Dots away from that axis are poles of the other factor, $h(z)$.],
  ),
  (
    [2  Expand, then subtract],
    figure-1,
    [Expanding the contour also encloses poles of $h$. Clockwise circles subtract them back out. The outer arc vanishes only if the full integrand decays sufficiently fast.],
  ),

  (
    [3  Separate the half-planes],
    figure-2,
    [Contours $C_1$ and $C_2$ run on opposite sides of the imaginary axis. Deformation preserves the integral only while no singularity crosses the path.],
  ),
  (
    [4  Identify additional singularities],
    figure-3,
    [Here the example has poles at $+E$ and $-E$ and a real-axis cut. This is a different singularity pattern from the four-pole sketch above.],
  ),

  (
    [5  Follow both sides of a cut],
    figure-4,
    [The branch-cut contour samples the difference between the limiting values above and below the cut. A cut contributes through this discontinuity.],
  ),
  (
    [6  Account for every contribution],
    figure-5,
    [The pictures are a bookkeeping guide, not a universal signed formula. Specify the thermal factor, its residues, and the analytic structure of the complete integrand.],
  ),
)
#v(12pt)
#takeaway[
  #set text(size: 14pt)
  #align(center)[
    *Bosons:* $omega_n = 2 pi n T$ #h(16pt) *Fermions:* $omega_n = (2n+1) pi T$\
    #v(5pt)
    Units: $k_"B" = ℏ = 1$. Check the arc at infinity before discarding it.
  ]
]