QFT Propagators
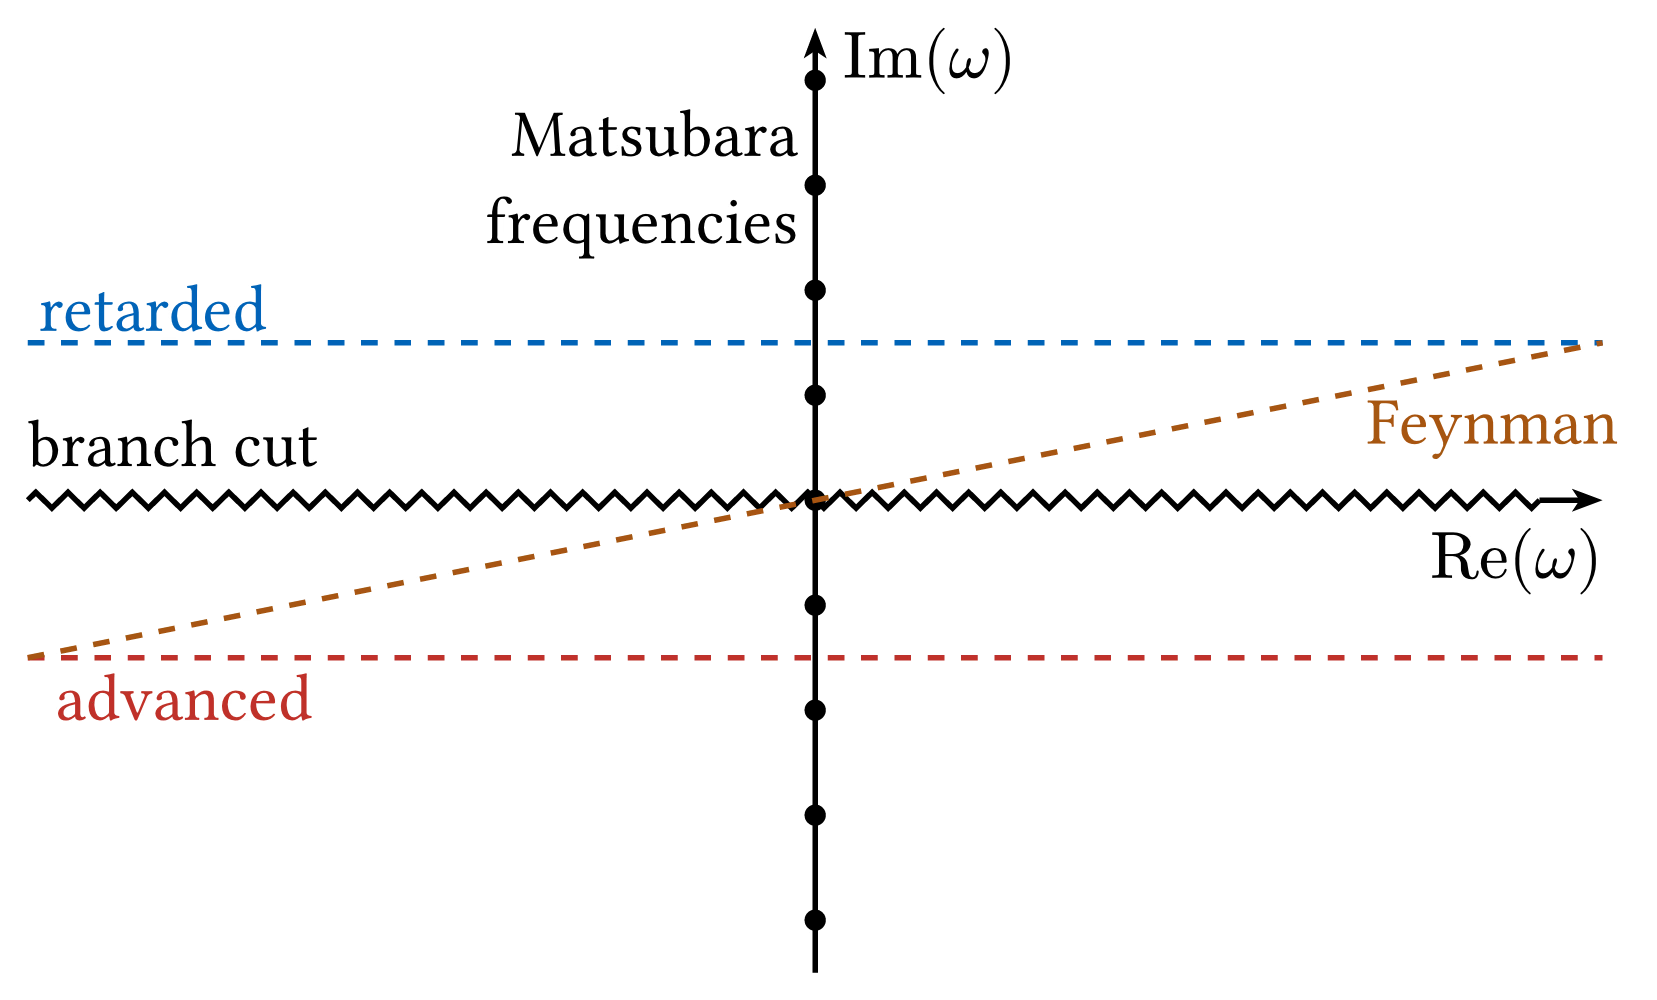
Complex frequency plane showing where the real-frequency integration contour runs for the retarded (just above the real axis), advanced (just below), and Feynman (below for negative, above for positive real frequencies) propagators. The zigzag marks the propagator's branch cut along the real axis, part of its analytic structure, while the dots on the imaginary axis are the Matsubara frequencies. This representation helps understanding causality in quantum field theory and the connection between real-time and imaginary-time (thermal) formalisms.
Download
Code
#import "@preview/cetz:0.5.3": canvas, decorations, draw
#import draw: circle, content, line

#set page(width: auto, height: auto, margin: 5pt, fill: none)
#set text(size: 12pt)

#let re-range = 5
#let im-range = 4
#let arrow-style = (end: "stealth", fill: black, scale: 0.5)

#canvas({
  // cetz decorations can't carry a mark (cetz-package/cetz#446), so the zigzag stops
  // short of the end and a straight stub carries the arrowhead
  let tip = 0.4
  decorations.zigzag(
    line((-re-range, 0), (re-range - tip, 0)),
    amplitude: 0.1,
    segment-length: 0.2,
  )
  line((re-range - tip, 0), (re-range, 0), mark: arrow-style, name: "x-axis")
  content("x-axis.end", $"Re"(omega)$, anchor: "north-east", padding: (top: 5pt))
  content((-re-range, 0), [branch cut], anchor: "south-west", padding: (bottom: 6pt))

  line((0, -im-range + 1), (0, im-range - 1), mark: arrow-style, name: "y-axis")
  content("y-axis.end", $"Im"(omega)$, anchor: "north-west", padding: (left: 5pt))

  // Matsubara frequencies
  for n in range(-im-range, im-range + 1) {
    circle((0, 2 / 3 * n), radius: 0.05, fill: black, name: "matsubara-" + str(n))
  }
  content((rel: (-1.1, 0), to: "matsubara-3"), align(right)[Matsubara\ frequencies])

  // Integration contours, each labeled at one end
  for (label, start, end, paint, label-pos, label-args) in (
    (
      "advanced",
      (-re-range, -1),
      (re-range, -1),
      red.darken(25%),
      (rel: (0, -0.4), to: "advanced.start"),
      (anchor: "south-west", padding: (left: 5pt)),
    ),
    (
      "retarded",
      (-re-range, 1),
      (re-range, 1),
      blue.darken(15%),
      "retarded.start",
      (anchor: "south-west", padding: 2pt),
    ),
    (
      "Feynman",
      (-re-range, -1),
      (re-range, 1),
      orange.darken(35%),
      (rel: (-0.7, -0.55), to: "Feynman.end"),
      (padding: 2pt),
    ),
  ) {
    line(start, end, stroke: (paint: paint, dash: "dashed"), name: label)
    content(label-pos, text(paint, label), ..label-args)
  }
})