« home

Complex Sign Function

physicsquantum field theoryMatsubaracetztikz

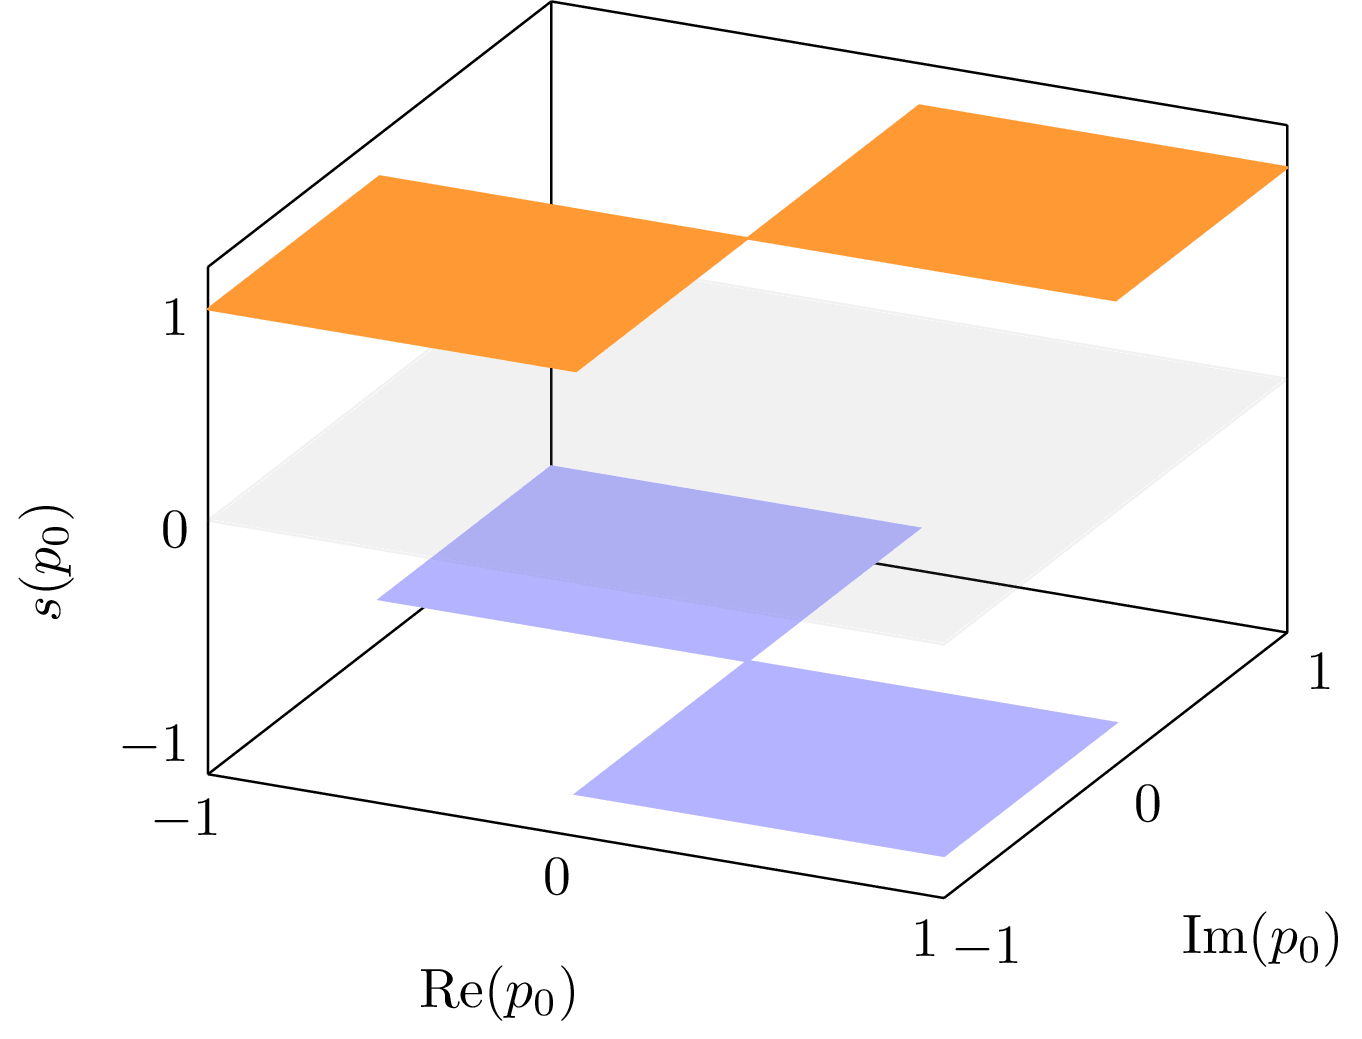
3d surface plot of the complex sign function s(p0)=\sign(p0p0)s(p_0) = \sign(\Re p_0 \, \Im p_0) over the complex plane. Used in the Matsubara summation of thermal quantum field theory to split contour integrals in the complex plane into two parts, the first being branch-cut free and the second evident branch cut structure.

Complex Sign Function

  Download

PNGPDFSVG

  Code

  LaTeX

complex-sign-function.tex (54 lines)

\documentclass{standalone}

\usepackage{mathtools,pgfplots}
\pgfplotsset{compat=newest}

\let\Im\relax
\DeclareMathOperator{\Im}{Im}
\let\Re\relax
\DeclareMathOperator{\Re}{Re}

\begin{document}
\begin{tikzpicture}
  \begin{axis}[
      xlabel=$\Re(p_0)$,
      ylabel=$\Im(p_0)$,
      zlabel=$s(p_0)$,
      domain=-1:1, surf, shader=flat,
      xtick distance=1,
      ytick distance=1,
      ztick distance=1,
      tickwidth=0,
    ]

    \addplot3[blue!30] coordinates {
        (-1, 1, -1) (0, 1, -1)

        (-1, 0, -1) (0, 0, -1)
      };

    \addplot3[blue!30] coordinates {
        (1, -1, -1) (0, -1, -1)

        (1, 0, -1) (0, 0, -1)
      };

    % Zero plane
    \addplot3[gray, opacity=0.1, samples=2]{0};

    \addplot3[orange!80] coordinates {
        (0, 0, 1) (1, 0, 1)

        (0, 1, 1) (1, 1, 1)
      };

    \addplot3[orange!80] coordinates {
        (0, 0, 1) (-1, 0, 1)

        (0, -1, 1) (-1, -1, 1)
      };

  \end{axis}
\end{tikzpicture}
\end{document}

  Typst

complex-sign-function.typ (82 lines)

#import "@preview/cetz:0.3.4": canvas, draw, vector, matrix
#import draw: set-transform, scale, content, line, rect, group

#set page(width: auto, height: auto, margin: 8pt)
#set text(size: 8pt)

#canvas({
  draw.set-style(line: (stroke: none))
  // Set up the transformation matrix for 3D perspective
  set-transform(matrix.transform-rotate-dir((1, 1, -2), (0, 2, .3)))
  scale(x: 1.5, z: -1)

  let arrow-style = (mark: (end: "stealth", fill: black, scale: 0.5))

  // Add vertical z-lines at corners and origin
  for (x, y) in ((-1, -1), (1, -1), (-1, 1), (1, 1)) {
    draw.line((x, y, -1.2), (x, y, 1.2), stroke: gray + .3pt)
  }
  draw.line((0, 0, -1.2), (0, 0, 1.2), stroke: gray + .3pt, ..arrow-style)


  // Draw the zero plane (gray, semi-transparent)
  group({
    draw.rect((-1, -1, 0), (1, 1, 0), fill: rgb(128, 128, 128, 20), stroke: none)
  })

  // Draw the blue quadrants (s = -1)
  group({
    draw.on-layer(
      -1,
      {
        draw.line(
          (-1, 0, -1),
          (0, 0, -1),
          (0, 1, -1),
          (-1, 1, -1),
          fill: rgb(173, 216, 230),
        )
        draw.line(
          (0, -1, -1),
          (1, -1, -1),
          (1, 0, -1),
          (0, 0, -1),
          fill: rgb(173, 216, 230),
        )
      },
    )
  })

  // Draw the orange quadrants (s = 1)
  group({
    draw.line(
      (0, 0, 1),
      (1, 0, 1),
      (1, 1, 1),
      (0, 1, 1),
      fill: rgb(255, 165, 0),
    )
    draw.line(
      (-1, -1, 1),
      (0, -1, 1),
      (0, 0, 1),
      (-1, 0, 1),
      fill: rgb(255, 165, 0),
    )
  })

  // Draw grid lines
  for x in range(-1, 2) {
    let style = if x == 0 { arrow-style } else { () }
    draw.line((x, -1, 0), (x, 1, 0), stroke: gray + .3pt, ..style)
  }
  for y in range(-1, 2) {
    let style = if y == 0 { arrow-style } else { () }
    draw.line((-1, y, 0), (1, y, 0), stroke: gray + .3pt, ..style)
  }

  content((1.45, .1, 0), [$"Re"(p_0)$])
  content((0, 1.6, 0), [$"Im"(p_0)$])
  content((0, 0, 1.5), [$s(p_0)$])
})