« home

Light

physicselectromagnetismwavesopticselectromagnetic radiationMaxwell's equationscetz

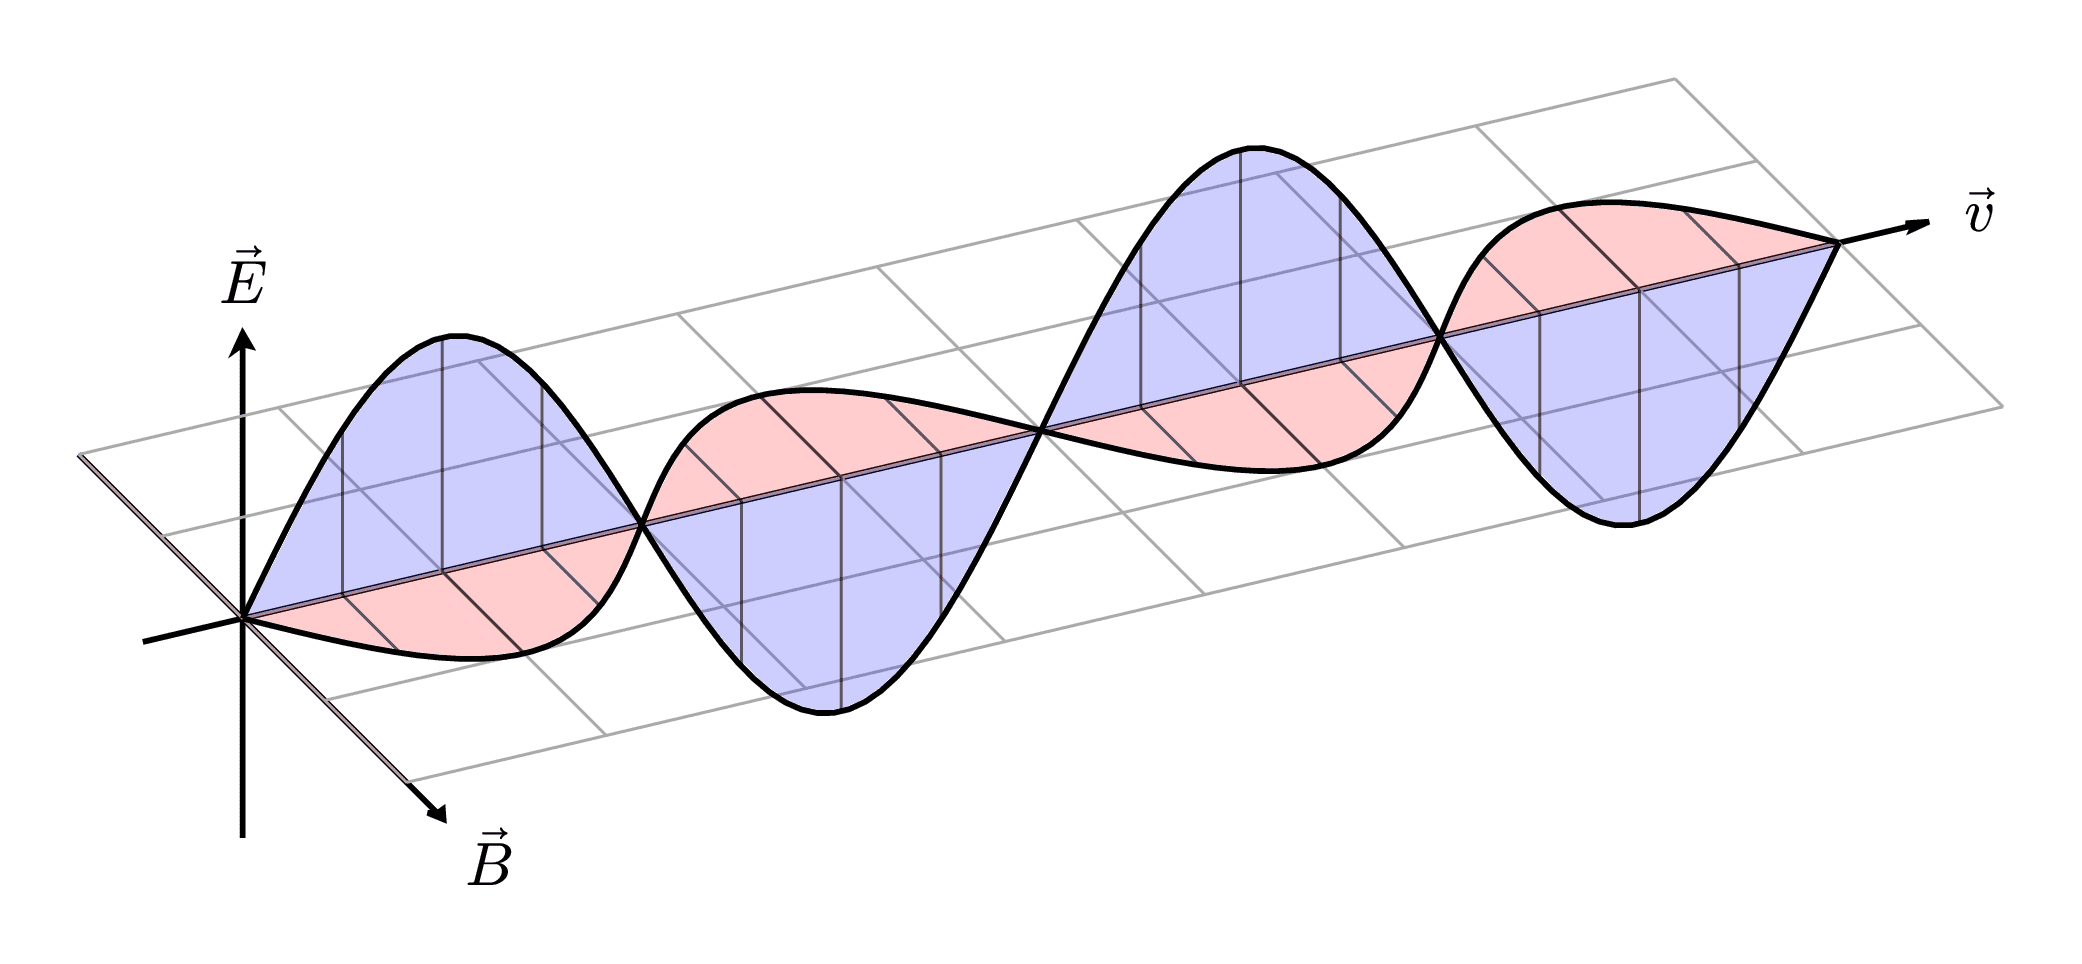
Visualization of a linearly polarized electromagnetic wave propagating in the z-direction, showing the orthogonal electric (E) and magnetic (B) field components oscillating in phase. The electric field (blue) and magnetic field (red) are perpendicular to each other and to the direction of propagation, forming a transverse wave as described by Maxwell's equations. This is a fundamental representation of electromagnetic radiation, which includes visible light, radio waves, X-rays, and other forms of electromagnetic waves that travel at the speed of light in vacuum.

Light

  Download

PNGPDF

  Code

  Typst

light.typ (56 lines)


// adapted from https://github.com/cetz-package/cetz/blob/a082e02a/gallery/waves.typ
#import "@preview/cetz:0.3.2": canvas, draw, vector, matrix

#set page(width: auto, height: auto, margin: .5cm)

#canvas({
  import draw: set-transform, scale, content, line, grid, group, rotate

  // Set up the transformation matrix
  set-transform(matrix.transform-rotate-dir((1, 1, -1.3), (0, 1, .4)))
  scale(x: 1.5, z: -1)
  let arrow-style = (mark: (end: "stealth", fill: black, scale: 0.5))
  // Coordinate axes labels and arrows
  draw.line((0, -2, 0), (0, 2.5, 0), ..arrow-style)
  draw.line((-0.5, 0, 0), (8.5, 0, 0), ..arrow-style)
  draw.line((0, 0, -1.5), (0, 0, 2), ..arrow-style)
  content((0, 0, 2.3), [$arrow(E)$])
  content((0, 3, 0), [$arrow(B)$])
  content((8.7, 0, 0), [$arrow(v)$])

  grid((0, -2), (8, 2), stroke: gray + .5pt)

  // Draw a sine wave on the xy plane
  let wave(amplitude: 1, fill: none, phases: 2, scale: 8, samples: 100) = {
    line(
      ..(
        for x in range(0, samples + 1) {
          let x = x / samples
          let p = (2 * phases * calc.pi) * x
          ((x * scale, calc.sin(p) * amplitude),)
        }
      ),
      fill: fill,
    )

    let subdivs = 8
    for phase in range(0, phases) {
      let x = phase / phases
      for div in range(1, subdivs + 1) {
        let p = 2 * calc.pi * (div / subdivs)
        let y = calc.sin(p) * amplitude
        let x = x * scale + div / subdivs * scale / phases
        line((x, 0), (x, y), stroke: rgb(0, 0, 0, 150) + .5pt)
      }
    }
  }

  // Draw waves
  group({
    rotate(x: 90deg)
    wave(amplitude: 1.6, fill: rgb(0, 0, 255, 50))
  })
  wave(amplitude: 1, fill: rgb(255, 0, 0, 50))
})