« home

Matsubara Contour 3

physicsquantum field theoryMatsubaracomplex analysisGreen's functionthermal field theorycontour integrationfrequency sumscetztikz

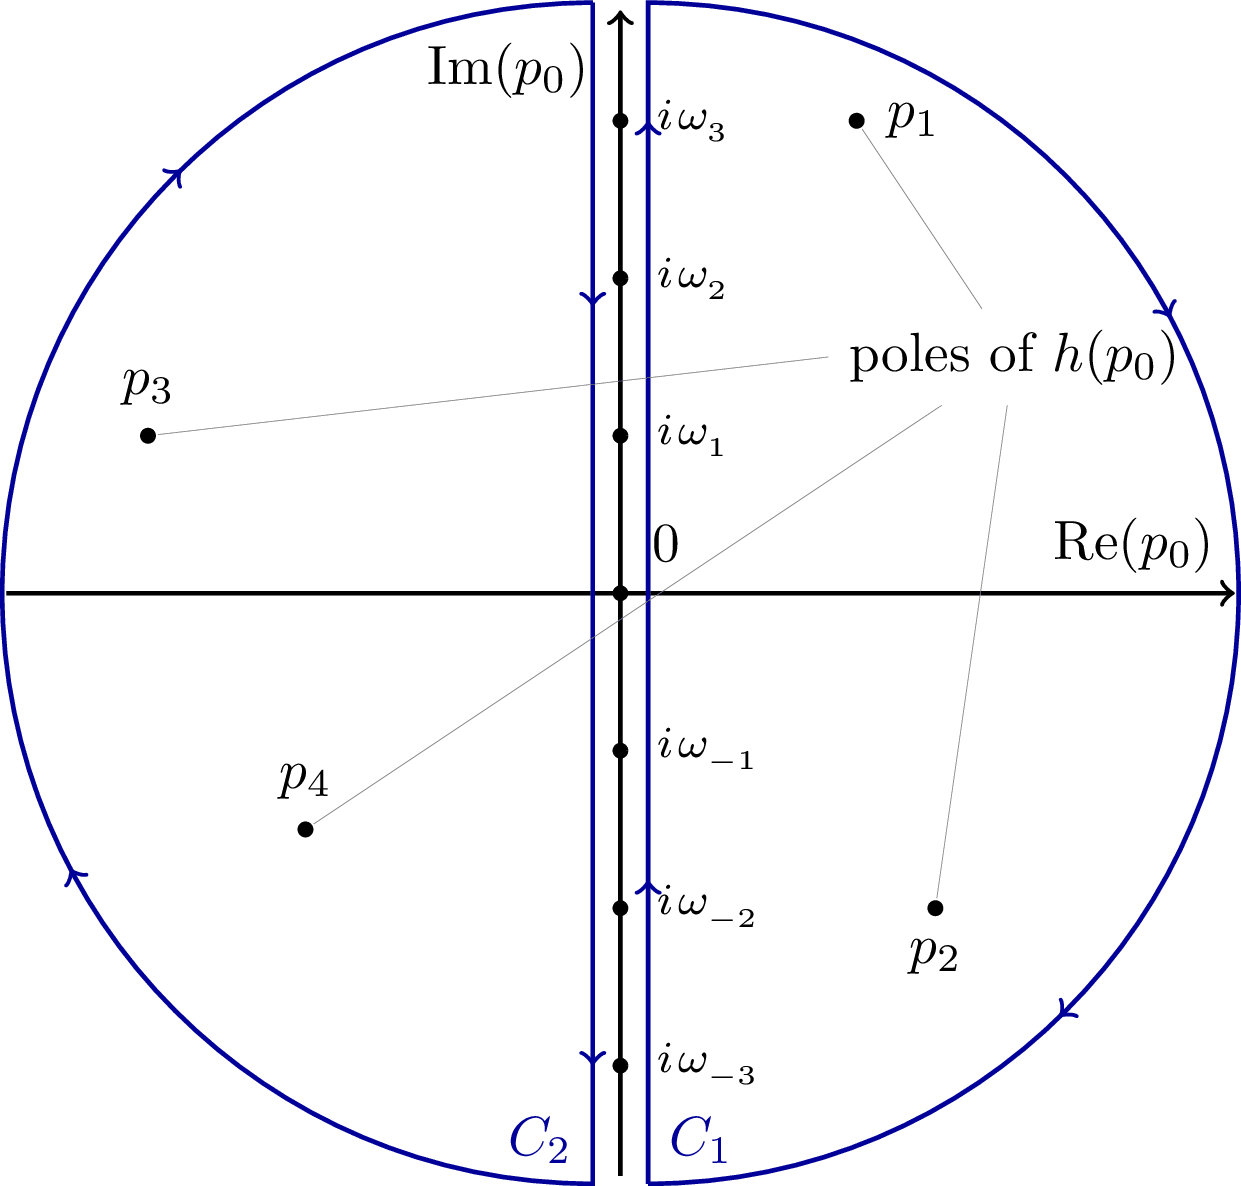
Second deformation of the Matsubara contour where the small circles C₁ and C₂ are expanded to enclose the entire complex plane except for the imaginary axis. This contour picks up both pole and branch cut contributions from the propagator, with the branch cuts arising from the sign function s(p₀).

Matsubara Contour 3

  Download

PNGPDFSVG

  Code

  LaTeX

matsubara-contour-3.tex (48 lines)

\documentclass[tikz]{standalone}

\usepackage{mathtools}

\let\Im\relax
\DeclareMathOperator{\Im}{Im}
\let\Re\relax
\DeclareMathOperator{\Re}{Re}

\usetikzlibrary{decorations.markings,positioning}

\providecommand{\poles}{
  \node (poles) at (2.5,1.5) {poles of $h(p_0)$};
  \draw[fill]
  (1.5,3) coordinate [circle,fill,inner sep=1pt,label=right:$p_1$] (p1)
  (2,-2) coordinate [circle,fill,inner sep=1pt,label=below:$p_2$] (p2)
  (-3,1) coordinate [circle,fill,inner sep=1pt,label=above:$p_3$] (p3)
  (-2,-1.5) coordinate [circle,fill,inner sep=1pt,label=above:$p_4$] (p4);
  \draw[ultra thin,gray] (poles) -- (p1) (poles) -- (p2) (poles.west) -- (p3) (poles) -- (p4);
}

\def\xr{3.5}
\def\yr{3}

\begin{document}
\begin{tikzpicture}[thick]

  % Axes
  \draw[->] (-\xr-0.4,0) -- (\xr+0.4,0) node [above left] {$\Re(p_0)$};
  \draw[->] (0,-\yr-0.7) -- (0,\yr+0.7) node[below left=0.1] {$\Im(p_0)$};

  % Matsubara frequencies
  \foreach \n in {-\yr,...,-1,1,2,...,\yr}{%
      \draw[fill] (0,\n) circle (1pt) node [right=0.1,font=\footnotesize] {$i \mkern2mu \omega_{_{\n}}$};}
  \draw[fill] (0,0) circle (1pt) node [above right=0.1] {0};

  % Right contour line
  \draw[xshift=5,blue!60!black,decoration={markings,mark=between positions 0.1 and 1 step 0.25 with \arrow{>}},postaction={decorate}] (0,-\yr-0.75) node [above right] {$C_1$} -- (0,\yr+0.75) arc (90:-90:\yr+0.75);

  % Left contour line
  \draw[xshift=-5,blue!60!black,decoration={markings,mark=between positions 0.1 and 1 step 0.25 with \arrow{>}},postaction={decorate}] (0,\yr+0.75) -- (0,-\yr-0.75) node [above left] {$C_2$} arc (270:90:\yr+0.75);

  % Poles
  \poles

\end{tikzpicture}
\end{document}

  Typst

matsubara-contour-3.typ (121 lines)

#import "@preview/cetz:0.3.4": canvas, draw
#import draw: line, content, circle, arc, set-style

#set page(width: auto, height: auto, margin: 8pt)

// Constants
#let x-range = 3
#let y-range = 3
#let main-radius = y-range + 1.5
#let pole-radius = 0.5
#let dot-radius = 0.05
#let small-dot-radius = 0.03
#let y-offset = 0.25

// Styles
#let arrow-style = (mark: (end: "stealth", scale: 0.5))
#let dark-blue = blue.darken(20%)
#let marc-style = (symbol: "stealth", fill: dark-blue, scale: 0.5, shorten-to: none)
#let gray-line = (paint: gray, thickness: 0.2pt)
#let contour-style = (paint: dark-blue, thickness: 0.8pt)

// Helper function to draw poles
#let draw-poles(poles-label-pos) = {
  content(poles-label-pos, [poles of $h(p_0)$], name: "poles-label")

  // Pole positions: (x, y, name, anchor)
  let pole-positions = (
    (1.5, 3, "p1", "west"),
    (2, -2, "p2", "north"),
    (-3, 1, "p3", "south"),
    (-2, -1.5, "p4", "north"),
  )

  for (x, y, name, anchor) in pole-positions {
    circle((x, y), radius: dot-radius, fill: black, name: name)
    content(name, $p_#name.last()$, anchor: anchor, padding: 2pt)

    let connect-point = if name == "p3" { "poles-label.west" } else { "poles-label" }
    line(connect-point, name, stroke: gray-line)
  }
}

// Helper function to draw a semicircle with arrows
#let draw-semicircle(center-x, start-angle, end-angle, name) = {
  arc(
    (center-x, 0),
    radius: main-radius,
    start: start-angle,
    stop: end-angle,
    stroke: contour-style,
    mark: (
      end: (
        (pos: 25%, ..marc-style),
        (pos: 50%, ..marc-style),
        (pos: 75%, ..marc-style),
      ),
    ),
    name: name,
    anchor: "origin",
  )
}

// Helper function to draw a vertical line with arrows
#let draw-vertical-line(x, start-y, end-y, name) = {
  line(
    (x, start-y),
    (x, end-y),
    stroke: contour-style,
    mark: (
      end: (
        (pos: 25%, ..marc-style),
        (pos: 50%, ..marc-style),
        (pos: 75%, ..marc-style),
      ),
    ),
    name: name,
  )
}

#canvas({
  // Draw axes
  line((-main-radius - y-offset, 0), (main-radius + y-offset, 0), ..arrow-style, name: "x-axis")
  content("x-axis.end", $"Re"(p_0)$, anchor: "south-east", padding: 2pt)

  line((0, -main-radius), (0, main-radius), ..arrow-style, name: "y-axis")
  content("y-axis.97%", $"Im"(p_0)$, anchor: "north-east", padding: (right: 8pt))

  // Draw Matsubara frequencies
  for n in range(-y-range, y-range + 1) {
    if n != 0 {
      circle((0, n), radius: small-dot-radius, fill: black, name: "freq-" + str(n))
      content(
        "freq-" + str(n),
        $i omega_#text(size: 0.7em)[#n]$,
        anchor: "west",
        padding: (left: 10pt),
      )
    }
  }

  // Draw origin
  circle((0, 0), radius: small-dot-radius, fill: black, name: "origin")
  content("origin", [0], anchor: "south-west", padding: (left: 10pt, bottom: 3pt))

  // Draw split contour
  // Right half (C₁): vertical line down + right semicircle
  draw-vertical-line(y-offset, main-radius, -main-radius, "right-line")
  draw-semicircle(y-offset, -90deg, 90deg, "right-arc")

  // Left half (C₂): vertical line up + left semicircle
  draw-vertical-line(-y-offset, -main-radius, main-radius, "left-line")
  draw-semicircle(-y-offset, 90deg, 270deg, "left-arc")

  // Add contour labels
  content("right-line.end", text(fill: dark-blue)[$C_1$], anchor: "south-west", padding: 4pt)
  content("left-line.start", text(fill: dark-blue)[$C_2$], anchor: "south-east", padding: 4pt)

  // Draw poles
  draw-poles((2.5, 1.5))
})