« home

Sabatier Principle

physicschemistrycetztikz

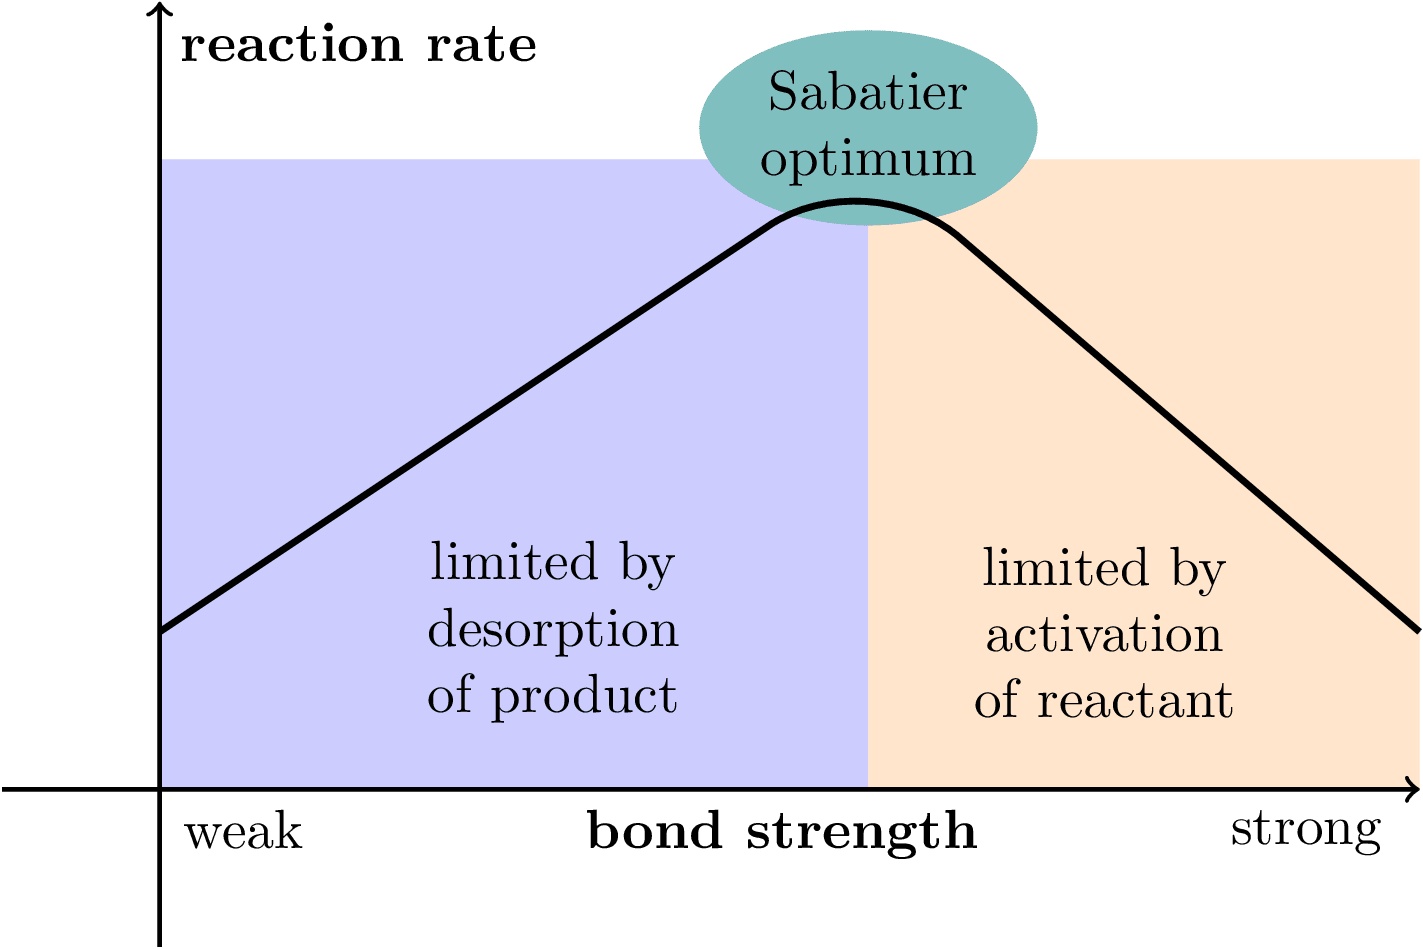
Illustration of the Sabatier principle in heterogeneous catalysis. Inspired by From the Sabatier principle to a predictive theory of transition-metal heterogeneous catalysis.

Sabatier Principle

  Download

PNGPDFSVG

  Code

  LaTeX

sabatier-principle.tex (19 lines)

\documentclass[tikz]{standalone}

\usetikzlibrary{shapes}

\begin{document}
\begin{tikzpicture}[thick, align=center]

  \fill[blue!20] (0,0) rectangle (4.5,4);
  \fill[orange!20] (4.5,0) rectangle (8,4);
  \node at (2.5,1) {limited by\\desorption\\of product};
  \node at (6,1) {limited by\\activation\\of reactant};
  \node[ellipse, fill=teal!50, inner sep=2pt] at (4.5,4.2) {Sabatier\\optimum};
  \draw[->] (-1,0) -- (8,0) node[below, pos=0.17] {weak} node[below, pos=0.55, font=\bfseries] {bond strength} node[below, pos=0.92] {strong};
  \draw[->] (0,-1) -- (0,5) node[below right, font=\bfseries] {reaction rate};
  \draw[rounded corners=5ex, very thick] (0,1) -- (4.5,4) -- (8,1);

\end{tikzpicture}
\end{document}

  Typst

sabatier-principle.typ (74 lines)

#import "@preview/cetz:0.3.2": canvas, draw

#set page(width: auto, height: auto, margin: 8pt)

#canvas({
  import draw: line, content, rect, hobby, circle

  // Draw background rectangles
  rect(
    (0, 0),
    (4.5, 4),
    fill: rgb(200, 220, 255), // blue!20
    stroke: none,
  )
  rect(
    (4.5, 0),
    (8, 4),
    fill: rgb(255, 230, 200), // orange!20
    stroke: none,
  )

  // Draw axes
  let arrow-style = (mark: (end: "stealth", fill: black, scale: 0.7), stroke: black + 1pt)
  let axis-overshoot = -0.75
  line((axis-overshoot, 0), (8, 0), ..arrow-style, name: "x-axis") // x-axis
  line((0, axis-overshoot), (0, 5), ..arrow-style, name: "y-axis") // y-axis

  // Add axis labels
  content((rel: (-axis-overshoot, -0.2), to: "x-axis.6%"), "weak", anchor: "north")
  content((rel: (-axis-overshoot, -0.25), to: "x-axis.50%"), text(weight: "bold")[bond strength], anchor: "north")
  content((rel: (0, -0.2), to: "x-axis.95%"), "strong", anchor: "north")
  content((rel: (0.1, 0), to: "y-axis.95%"), text(weight: "bold")[reaction rate], anchor: "west")

  // Add region labels
  content(
    (2.5, 1),
    align(center)[limited by\ desorption\ of product],
  )
  content(
    (6, 1),
    align(center)[limited by\ activation\ of reactant],
  )

  // Draw Sabatier optimum label
  let ellipse-center = (4.5, 4.2)
  let ellipse-width = 1.2
  let ellipse-height = ellipse-width / 2

  // Draw ellipse background
  circle(
    ellipse-center,
    radius: (ellipse-width, ellipse-height),
    fill: teal,
    stroke: none,
  )

  // Draw volcano curve using hobby spline
  hobby(
    (0, 1),
    (2, 2.6),
    (4.5, 3.7),
    (6, 2.8),
    (8, 1),
    stroke: black + 1.2pt,
    omega: 1,
  )
  // Add label
  content(
    ellipse-center,
    align(center)[Sabatier\ optimum],
    padding: 2pt,
  )
})