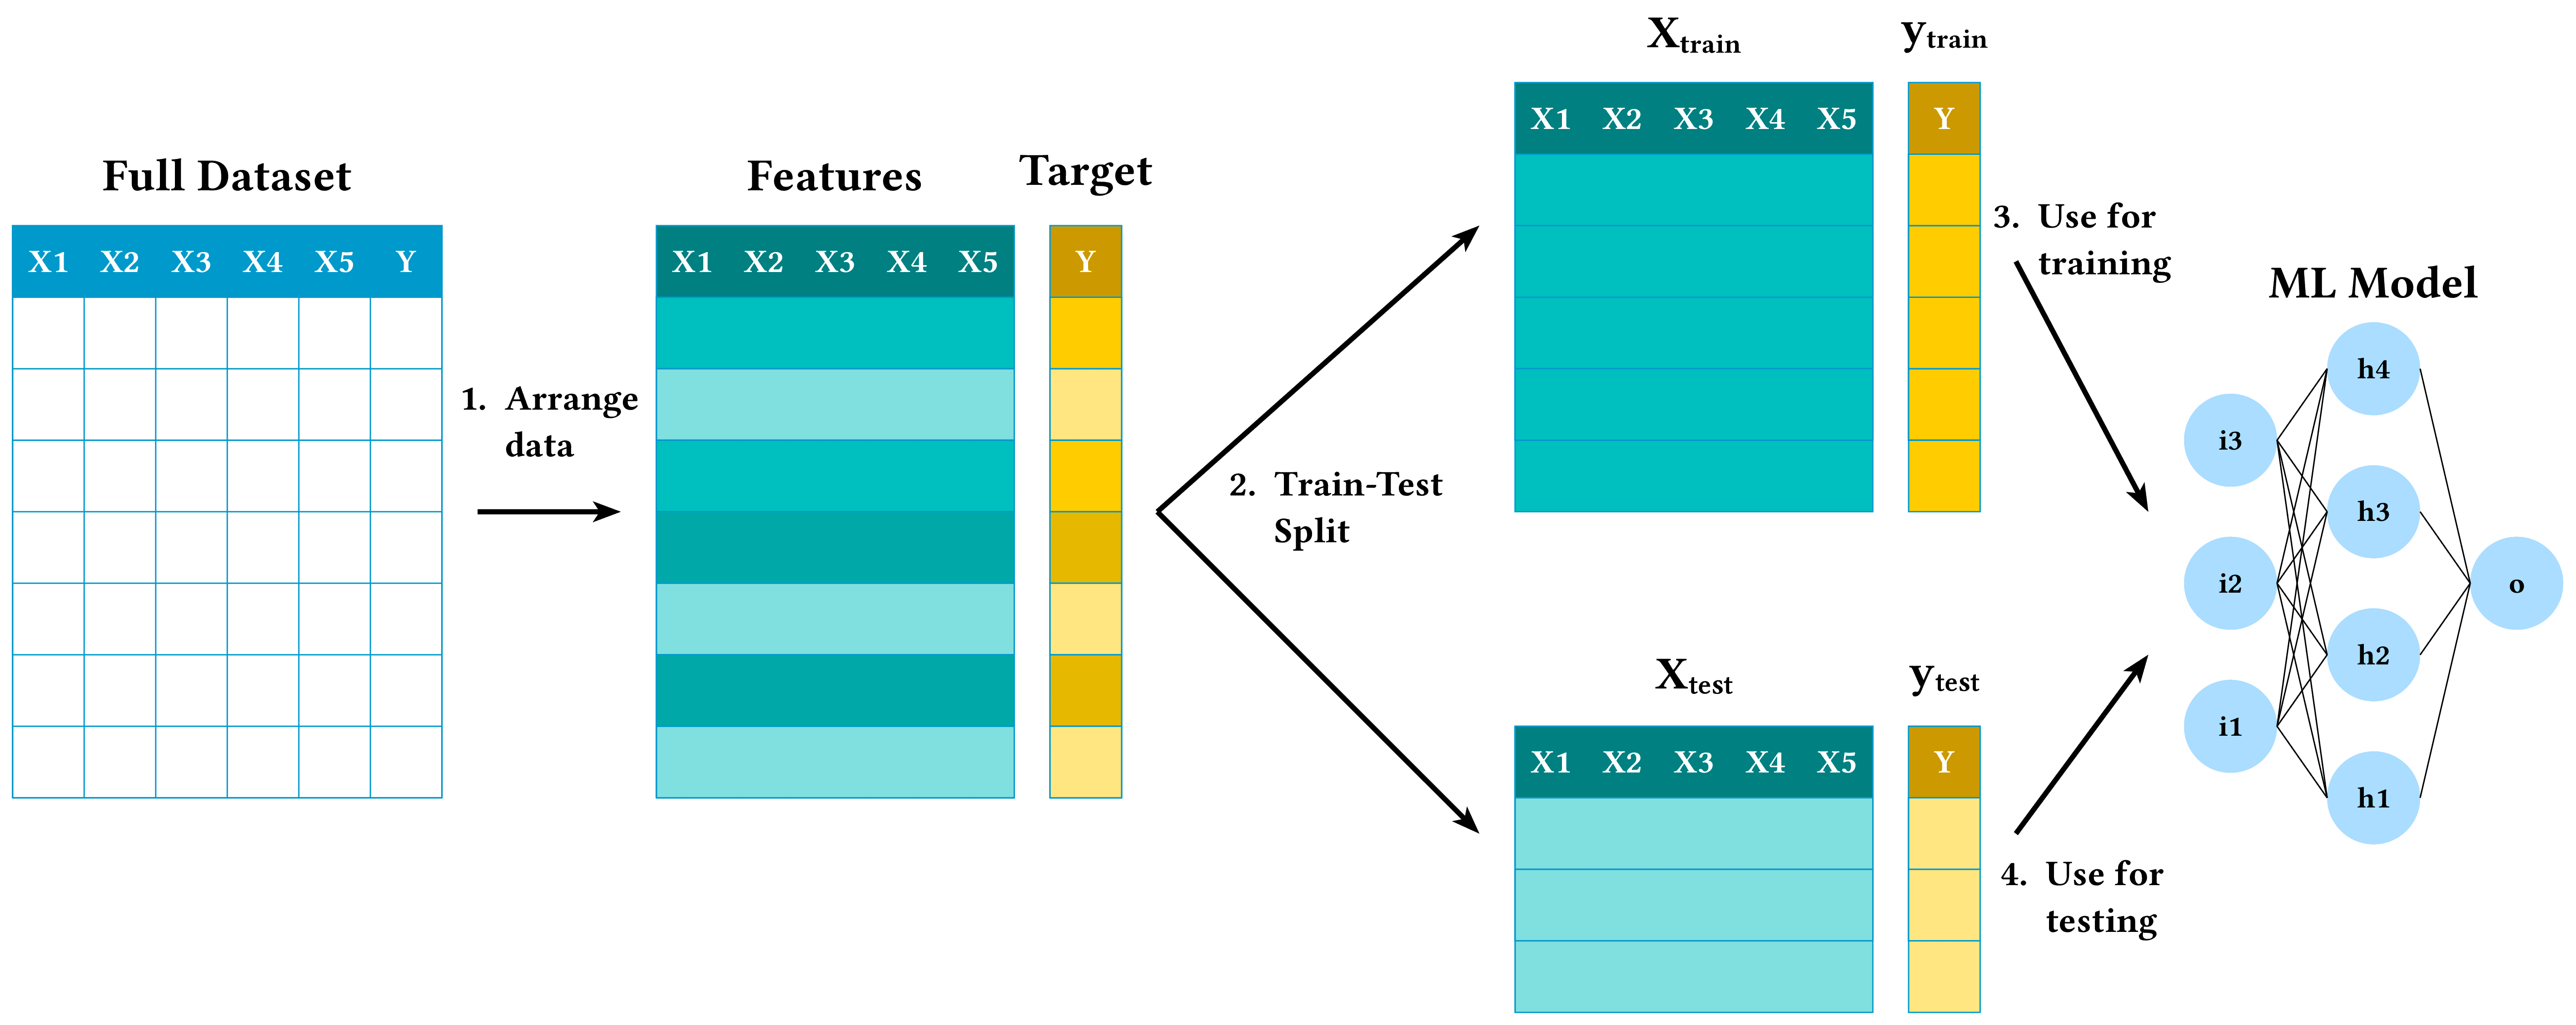
Illustration of the train-test split concept in machine learning. The diagram shows how a full dataset is divided into features (X) and target (y) matrices, which are then split into training and testing subsets. The training data (X_train, y_train) is used to train a machine learning model, while the test data (X_test, y_test) is used to evaluate the model's performance on unseen data. This separation helps assess how well the model generalizes to new examples. The diagram uses color coding to distinguish between training data (darker) and test data (lighter), with a neural network representation of the ML model.
#import "@preview/cetz:0.3.4": canvas, draw
#import draw: line, content, rect, circle, grid
#set page(width: auto, height: auto, margin: 5pt)
#canvas({
// Define styles and colors
let data-color = rgb("#00bfbf") // Teal color for data matrices
let data-color-alt = rgb("#00a8a8") // Slightly darker teal for alternating rows
let test-data-color = rgb("#80dfdf") // Lighter teal for test data
let target-color = rgb("#ffcc00") // Yellow color for target/labels
let target-color-alt = rgb("#e6b800") // Slightly darker yellow for alternating rows
let test-target-color = rgb("#ffe680") // Lighter yellow for test target
let arrow-style = (
stroke: black + 2pt,
mark: (end: "stealth", size: 10pt),
)
let step-text-style = (
fill: black,
weight: "bold",
size: 14.3pt, // Increased by 30% from 11pt
)
let label-text-style = (
fill: black,
weight: "bold",
size: 18.2pt, // Increased by 30% from 14pt
)
let header-text-style = (
fill: white,
weight: "bold",
size: 13pt, // Increased by 30% from 10pt
)
let neuron-text-style = (
fill: black,
weight: "bold",
size: 11.7pt, // Increased by 30% from 9pt
)
let matrix-stroke = 0.5pt + rgb("#0099cc")
let neuron-style = (
fill: rgb("#aaddff"),
stroke: none, // Remove border from neurons
)
// Define spacing constants
let component-spacing = 5 // Increased spacing between components
let vertical-center = 0
let label-offset = 0.7 // Reduced from 1.0 to move labels closer to tables
// Define matrix dimensions
let full-data-width = 6
let full-data-height = 8
let feature-width = 5
let target-width = 1
let train-height = 5.0 // Increased to have 5 rows + header
let test-height = 3.0 // Adjusted to ensure square cells (3 rows + header)
let header-height = 1.0 // Standard header height for all tables
let row-height = 1.0 // Define standard row height for consistency
// Define positions - increased spacing between components and vertically centered
let full-data-x = -15 // Moved further left
let features-x = -6 // Moved further left
let target-x = features-x + feature-width + 0.5
let train-x = 6 // Moved further right
let test-x = train-x
let test-y = -8.0 // Increased vertical separation between train and test tables
let model-x = 18 // Moved further right to avoid overlap with train data
// Vertical offset to move full dataset, features, and target tables down
let top_tables_y_offset = -3.5 // Increased from -2.0 to move tables further down
// Vertical offset for neural network - move further down for better centering
let nn_y_offset = -4.5 // Increased from -3.0 to move neural network further down
// Define which rows will be part of the test set (random selection)
// We'll use a fixed set of indices for the test set to simulate random sampling
let test-indices = (1, 4, 6) // Rows 1, 4, and 6 will be part of the test set (0-indexed)
// Helper function to create a table with header
let create_table(x, y, width, height, fill, header_fill, header_texts) = {
// Calculate number of rows (excluding header)
let num_rows = int((height - header-height) / row-height)
// Draw main rectangle for the table background
rect(
(x, y + height / 2),
(x + width, y - height / 2),
stroke: matrix-stroke,
fill: fill,
)
// Add header row
rect(
(x, y + height / 2),
(x + width, y + height / 2 - header-height),
stroke: matrix-stroke,
fill: header_fill,
)
// Add header texts
let col_count = header_texts.len()
for i in range(0, col_count) {
content(
(x + 0.5 + i, y + height / 2 - header-height / 2),
text(..header-text-style)[#header_texts.at(i)],
anchor: "center",
)
}
// Draw explicit grid lines for the data area
// Horizontal lines
for i in range(0, num_rows + 1) {
let y-pos = y + height / 2 - header-height - i * row-height
line(
(x, y-pos),
(x + width, y-pos),
stroke: matrix-stroke,
)
}
// Vertical lines
for i in range(0, int(width) + 1) {
let x-pos = x + i
line(
(x-pos, y + height / 2 - header-height),
(x-pos, y - height / 2),
stroke: matrix-stroke,
)
}
}
// Helper function to add a label above a table
let add_table_label(x, y, width, height, label_text) = {
content(
(x + width / 2, y + height / 2 + label-offset),
text(..label-text-style)[#label_text],
anchor: "center",
)
}
// Add labels for all components with proper subscripts
add_table_label(full-data-x, top_tables_y_offset, full-data-width, full-data-height, "Full Dataset")
add_table_label(features-x, top_tables_y_offset, feature-width, full-data-height, "Features")
add_table_label(target-x, top_tables_y_offset, target-width, full-data-height, "Target")
add_table_label(train-x, vertical-center, feature-width, train-height, [X#sub[train]])
add_table_label(train-x + feature-width + 0.5, vertical-center, target-width, train-height, [y#sub[train]])
add_table_label(test-x, test-y, feature-width, test-height, [X#sub[test]])
add_table_label(test-x + feature-width + 0.5, test-y, target-width, test-height, [y#sub[test]])
// Create header arrays
let feature_headers = ("X1", "X2", "X3", "X4", "X5")
let full_dataset_headers = feature_headers + ("Y",)
// Draw full dataset
create_table(
full-data-x,
top_tables_y_offset,
full-data-width,
full-data-height,
white,
rgb("#0099cc"),
full_dataset_headers,
)
// Draw features matrix
create_table(
features-x,
top_tables_y_offset,
feature-width,
full-data-height,
data-color,
rgb("#008080"),
feature_headers,
)
// Add alternating row colors to features
for i in range(0, 7) {
let row-y-top = top_tables_y_offset + full-data-height / 2 - header-height - i * row-height
let row-y-bottom = row-y-top - row-height
let is-test = test-indices.contains(i)
let row-color = if is-test { test-data-color } else if calc.rem(i, 2) == 0 { data-color } else { data-color-alt }
rect(
(features-x, row-y-top),
(features-x + feature-width, row-y-bottom),
stroke: matrix-stroke,
fill: row-color,
)
}
// Draw target vector
create_table(
target-x,
top_tables_y_offset,
target-width,
full-data-height,
target-color,
rgb("#cc9900"),
("Y",),
)
// Add alternating row colors to target
for i in range(0, 7) {
let row-y-top = top_tables_y_offset + full-data-height / 2 - header-height - i * row-height
let row-y-bottom = row-y-top - row-height
let is-test = test-indices.contains(i)
let row-color = if is-test { test-target-color } else if calc.rem(i, 2) == 0 { target-color } else {
target-color-alt
}
rect(
(target-x, row-y-top),
(target-x + target-width, row-y-bottom),
stroke: matrix-stroke,
fill: row-color,
)
}
// Draw X_train matrix
create_table(
train-x,
vertical-center,
feature-width,
train-height,
data-color,
rgb("#008080"),
feature_headers,
)
// Add uniform color to X_train rows
for i in range(0, 5) {
let row-y-top = vertical-center + train-height / 2 - header-height - i * row-height
let row-y-bottom = row-y-top - row-height
rect(
(train-x, row-y-top),
(train-x + feature-width, row-y-bottom),
stroke: matrix-stroke,
fill: data-color,
)
}
// Draw y_train vector
create_table(
train-x + feature-width + 0.5,
vertical-center,
target-width,
train-height,
target-color,
rgb("#cc9900"),
("Y",),
)
// Add uniform color to y_train rows
for i in range(0, 5) {
let row-y-top = vertical-center + train-height / 2 - header-height - i * row-height
let row-y-bottom = row-y-top - row-height
rect(
(train-x + feature-width + 0.5, row-y-top),
(train-x + feature-width + 0.5 + target-width, row-y-bottom),
stroke: matrix-stroke,
fill: target-color,
)
}
// Draw X_test matrix
create_table(
test-x,
test-y,
feature-width,
test-height,
test-data-color,
rgb("#008080"),
feature_headers,
)
// Add rows to X_test
for i in range(0, 3) {
let row-y-top = test-y + test-height / 2 - header-height - i * row-height
let row-y-bottom = row-y-top - row-height
rect(
(test-x, row-y-top),
(test-x + feature-width, row-y-bottom),
stroke: matrix-stroke,
fill: test-data-color,
)
}
// Draw y_test vector
create_table(
test-x + feature-width + 0.5,
test-y,
target-width,
test-height,
test-target-color,
rgb("#cc9900"),
("Y",),
)
// Add rows to y_test
for i in range(0, 3) {
let row-y-top = test-y + test-height / 2 - header-height - i * row-height
let row-y-bottom = row-y-top - row-height
rect(
(test-x + feature-width + 0.5, row-y-top),
(test-x + feature-width + 0.5 + target-width, row-y-bottom),
stroke: matrix-stroke,
fill: test-target-color,
)
}
// Draw neural network
let nn-x = model-x
let nn-y = vertical-center + nn_y_offset
let nn-width = 6
let nn-height = 6
let neuron-radius = 0.65
// Neural network label
content(
(nn-x, nn-y + nn-height / 2 + 1.2),
text(..label-text-style)[ML Model],
anchor: "center",
)
// Helper function to create a neuron
let create_neuron(x, y, name) = {
circle(
(x, y),
radius: neuron-radius,
fill: rgb("#aaddff"),
stroke: none, // Remove border
)
content(
(x, y),
text(..neuron-text-style)[#name],
anchor: "center",
)
}
// Input layer (3 neurons)
for i in range(0, 3) {
let y-pos = nn-y - 2 + i * 2
let node-name = "i" + str(i + 1)
create_neuron(nn-x - nn-width / 3, y-pos, node-name)
}
// Hidden layer (4 neurons)
for i in range(0, 4) {
let y-pos = nn-y - 3 + i * 2
let node-name = "h" + str(i + 1)
create_neuron(nn-x, y-pos, node-name)
}
// Output layer (1 neuron)
create_neuron(nn-x + nn-width / 3, nn-y, "o")
// Connections from input to hidden layer
for i in range(0, 3) {
let input-y = nn-y - 2 + i * 2
for j in range(0, 4) {
let hidden-y = nn-y - 3 + j * 2
line(
(nn-x - nn-width / 3 + neuron-radius, input-y),
(nn-x - neuron-radius, hidden-y),
stroke: black + 0.5pt,
)
}
}
// Connections from hidden to output layer
for j in range(0, 4) {
let hidden-y = nn-y - 3 + j * 2
line(
(nn-x + neuron-radius, hidden-y),
(nn-x + nn-width / 3 - neuron-radius, nn-y),
stroke: black + 0.5pt,
)
}
// Helper function to create an arrow with label
let create_arrow(start, end, label, label_offset) = {
line(
start,
end,
..arrow-style,
)
if label != "" {
let center-x = (start.at(0) + end.at(0)) / 2
let center-y = (start.at(1) + end.at(1)) / 2
content(
(center-x, center-y + label_offset),
text(..step-text-style)[#label],
anchor: "center",
)
}
}
// Arrow 1: Full dataset to features/target
let arrow1-start = (full-data-x + full-data-width + 0.5, top_tables_y_offset)
let arrow1-end = (features-x - 0.5, top_tables_y_offset)
create_arrow(arrow1-start, arrow1-end, [1. Arrange\ data], 1.2)
// Common starting point for both train and test arrows
let arrow2_common_start = (target-x + target-width + 0.5, top_tables_y_offset)
// Arrow 2a: Features/target to train data
let arrow2a-end = (train-x - 0.5, vertical-center + .5)
create_arrow(arrow2_common_start, arrow2a-end, "", 0)
// Arrow 2b: Features/target to test data
let arrow2b-end = (test-x - 0.5, test-y)
create_arrow(arrow2_common_start, arrow2b-end, "", 0)
// Train-Test Split label
content(
(target-x + target-width + 3.0, arrow2_common_start.at(1)),
text(..step-text-style)[2. Train-Test\ Split],
anchor: "center",
)
// Arrow 3: Train data to model
let arrow3-start = (train-x + feature-width + 0.5 + target-width + 0.5, vertical-center)
let arrow3-end = (nn-x - nn-width / 3 - neuron-radius - 0.5, nn-y + 1)
create_arrow(arrow3-start, arrow3-end, [3. Use for\ training], 2)
// Arrow 4: Test data to model
let arrow4-start = (test-x + feature-width + 0.5 + target-width + 0.5, test-y)
let arrow4-end = (nn-x - nn-width / 3 - neuron-radius - 0.5, nn-y - 1)
create_arrow(arrow4-start, arrow4-end, [4. Use for\ testing], -2.2)
})