Hydrogen Spectral Series
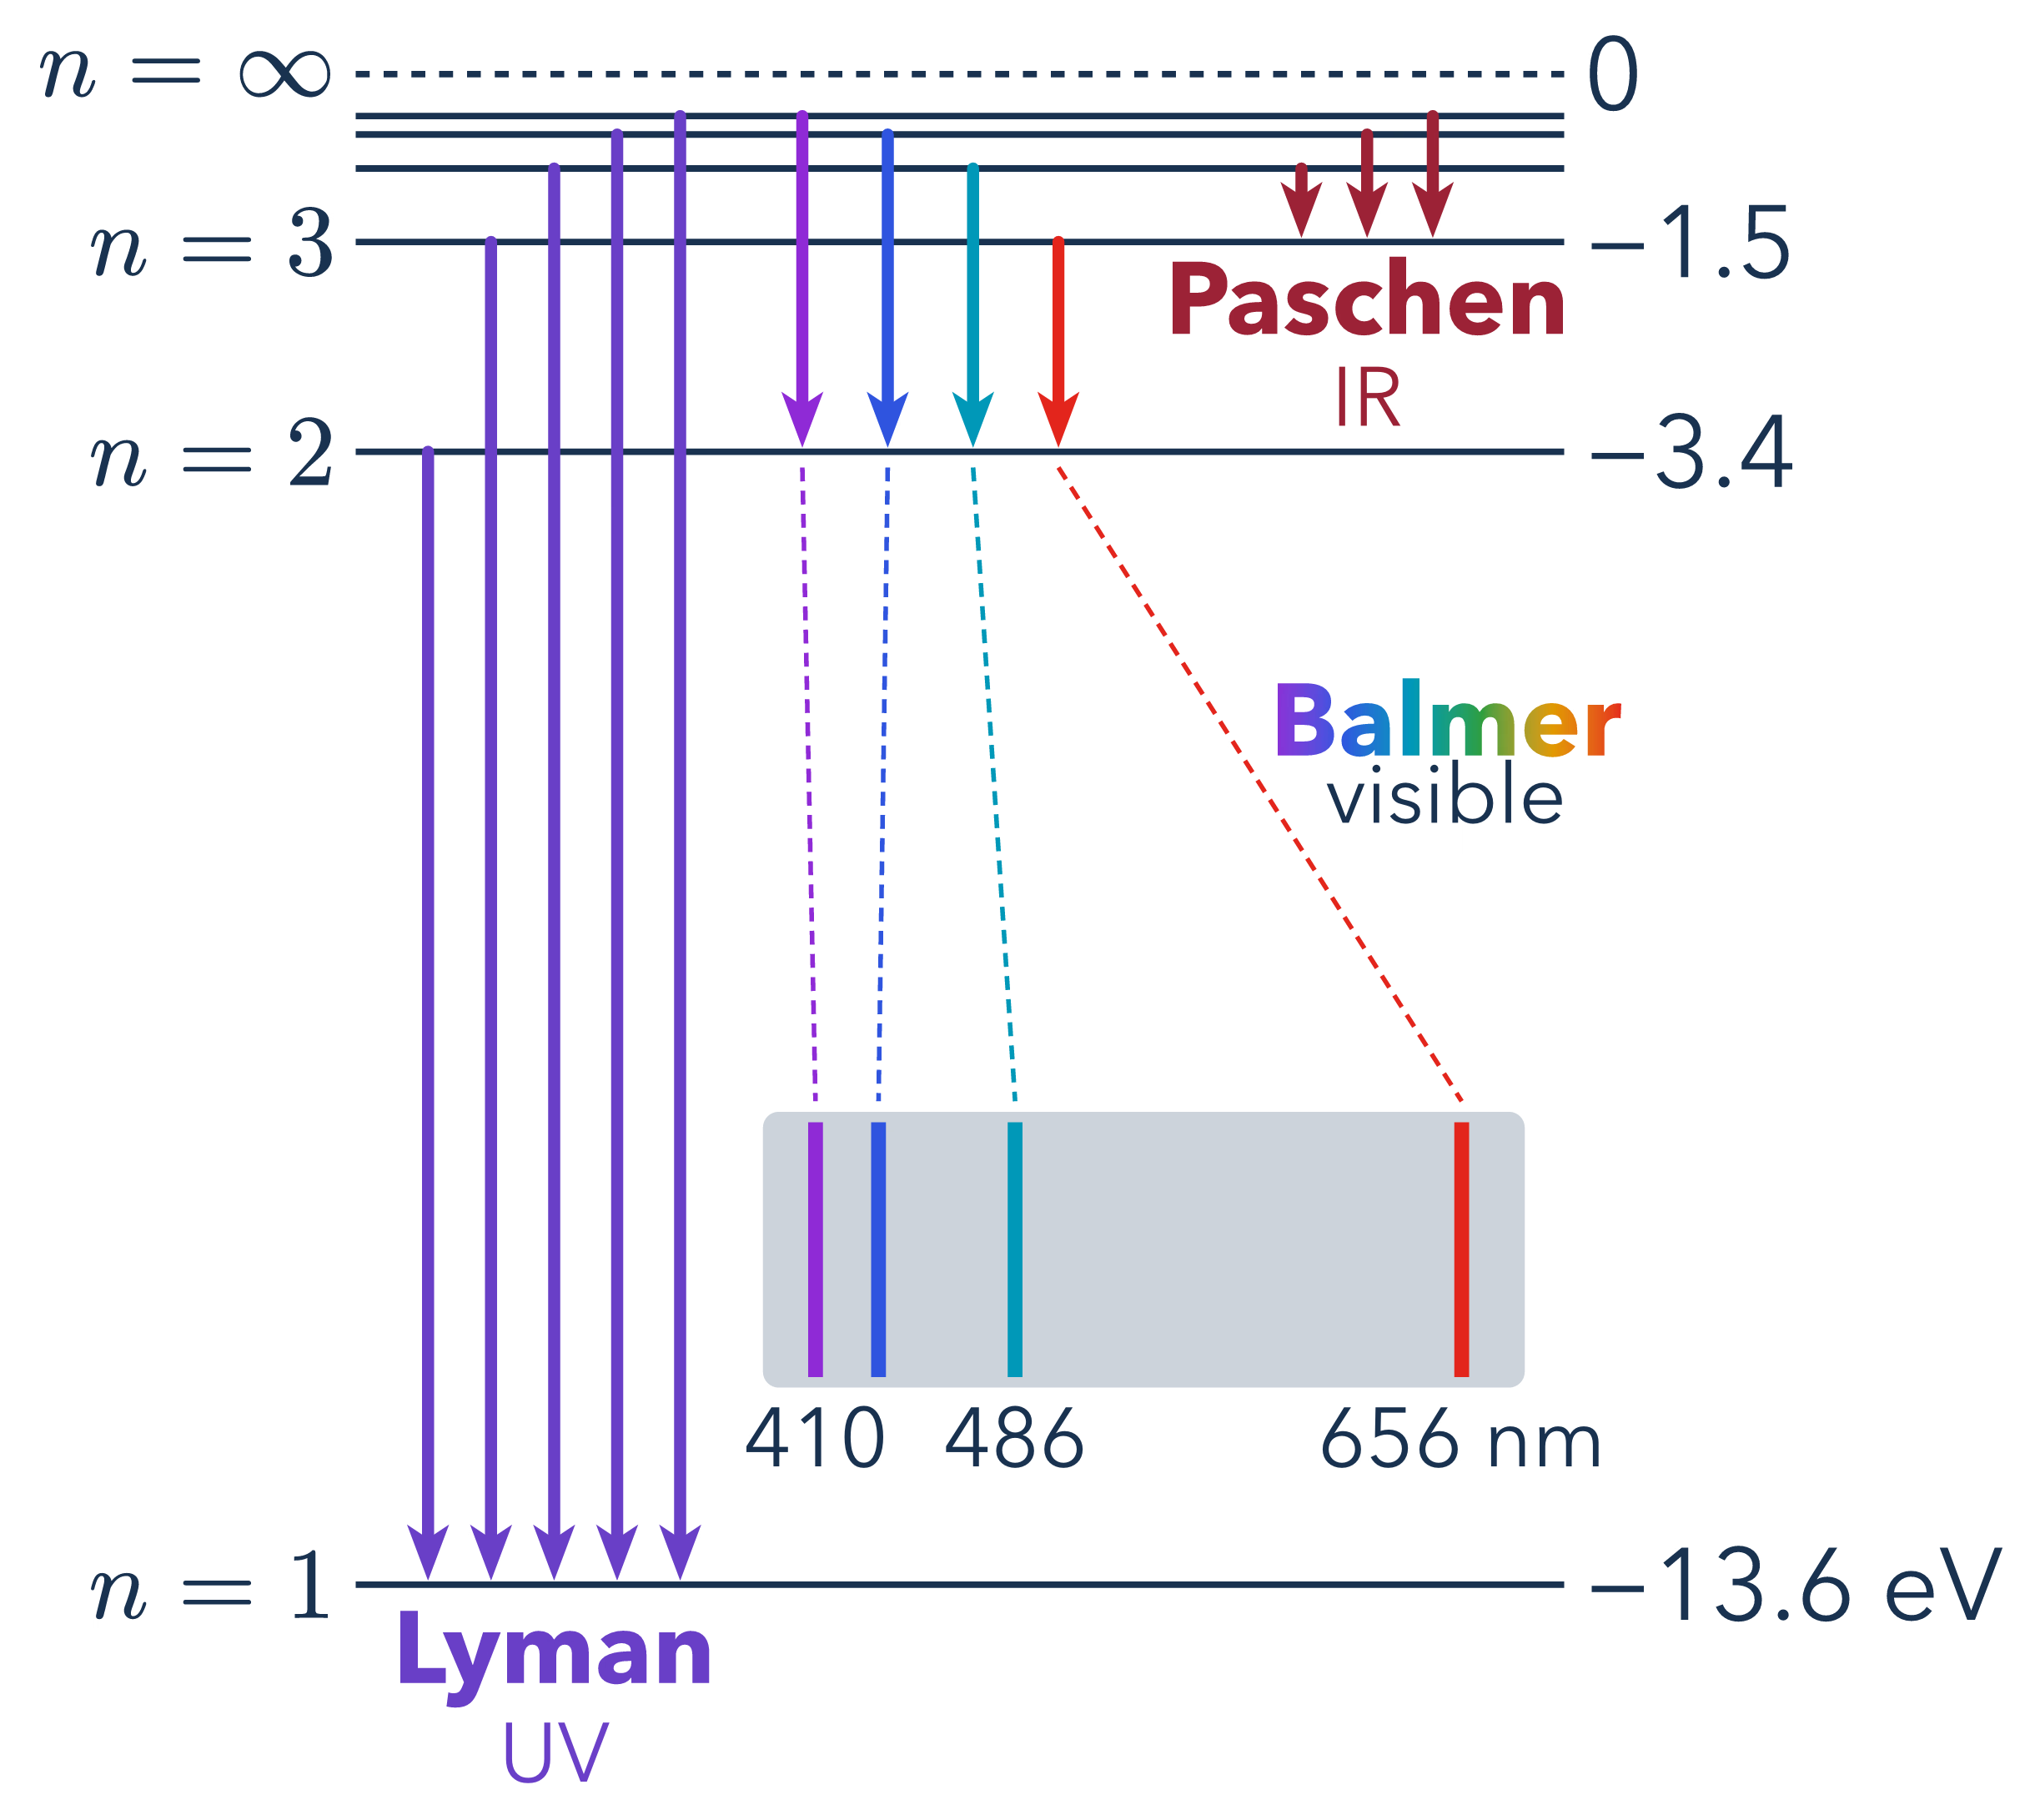
Energy levels of hydrogen, , drawn to scale with the transitions of the Lyman (, ultraviolet), Balmer (, visible) and Paschen (, infrared) series. Each emitted photon has wavelength given by the Rydberg formula, so the four visible Balmer lines H (656 nm), H (486 nm), H (434 nm) and H (410 nm) form the characteristic emission spectrum shown below the arrows. Within each series the lines crowd together toward a series limit set by the ionization threshold (dashed line).
Download
Code
#import "@preview/cetz:0.5.3": canvas, draw
#import draw: content, line, rect

#set page(width: auto, height: auto, margin: 8pt, fill: none)
#let ink = rgb("#19324f")
#set text(font: "Avenir Next", size: 22pt, fill: ink)

// Hydrogen levels E_n = -13.6 eV / n^2 on a linear energy scale; n = oo is the ionization limit.
#let y-span = 11.5 // canvas height from n = 1 to the ionization limit
#let y-of(n) = y-span * (1 - 1 / (n * n))
#let (x-left, x-right) = (1.2, 10.4)

#let lyman-color = rgb("#6a3fc8")
#let paschen-color = rgb("#9b2335")
// Balmer lines (upper level, wavelength in nm, color, arrow x): H-delta, H-gamma, H-beta, H-alpha.
// Arrows are ordered by wavelength like the spectrum below.
#let balmer = (
  (6, 410, rgb("#8f2bd6"), 4.6),
  (5, 434, rgb("#2f55e0"), 5.25),
  (4, 486, rgb("#0098b8"), 5.9),
  (3, 656, rgb("#e3261b"), 6.55),
)
// Visible-spectrum gradient for the Balmer series label
#let rainbow = gradient.linear(
  ..balmer.slice(0, 3).map(line => line.at(2)),
  rgb("#2e9e3e"),
  rgb("#e09a00"),
  balmer.last().at(2),
)

#let arrow(x, n-from, n-to, color) = draw.line(
  (x, y-of(n-from)),
  (x, y-of(n-to) + 0.03),
  stroke: (paint: color, thickness: 2.6pt, cap: "round"),
  mark: (end: "stealth", fill: color, scale: 0.9),
)

#canvas({
  // Energy levels, the ionization limit dashed
  for n in (1, 2, 3, 4, 5, 6, calc.inf) {
    let dash = if n == calc.inf { "dashed" }
    line((x-left, y-of(n)), (x-right, y-of(n)), stroke: (paint: ink, thickness: 1.4pt, dash: dash))
  }

  // Level labels: quantum number on the left, energy on the right
  for (n, label) in ((1, $n = 1$), (2, $n = 2$), (3, $n = 3$), (calc.inf, $n = oo$)) {
    content((x-left - 0.15, y-of(n)), label, anchor: "east")
  }
  for (n, label) in ((1, [−13.6 eV]), (2, [−3.4]), (3, [−1.5]), (calc.inf, [0])) {
    content((x-right + 0.15, y-of(n)), label, anchor: "west")
  }

  // Lyman series: n >= 2 -> 1 (ultraviolet)
  let lyman-x(idx) = 1.75 + 0.48 * idx
  for (idx, n) in range(2, 7).enumerate() {
    arrow(lyman-x(idx), n, 1, lyman-color)
  }
  content((lyman-x(2), -0.2), text(fill: lyman-color, weight: "bold")[Lyman], anchor: "north")
  content((lyman-x(2), -1.05), text(fill: lyman-color, size: 18pt)[UV], anchor: "north")

  // Balmer series: n >= 3 -> 2 (visible)
  for (n, _, color, x) in balmer {
    arrow(x, n, 2, color)
  }

  // Visible emission spectrum of the Balmer lines
  let (s-left, s-right, s-bottom, s-top) = (4.3, 10.1, 1.5, 3.6)
  let (lam-min, lam-max) = (390, 680)
  let x-of-lam(lam) = s-left + (s-right - s-left) * (lam - lam-min) / (lam-max - lam-min)
  rect((s-left, s-bottom), (s-right, s-top), fill: rgb("#cdd3da"), stroke: none, radius: 0.12)
  for (_, lam, color, x) in balmer {
    let xl = x-of-lam(lam)
    line(
      (x, y-of(2) - 0.12),
      (xl, s-top + 0.08),
      stroke: (paint: color, thickness: 1pt, dash: "densely-dashed"),
    )
    line((xl, s-bottom + 0.08), (xl, s-top - 0.08), stroke: color + 3.2pt)
  }
  for (lam, label) in ((410, [410]), (486, [486]), (656, [656 nm])) {
    content((x-of-lam(lam), s-bottom - 0.15), text(size: 18pt, label), anchor: "north")
  }
  content((9.5, 6.3), text(weight: "bold", fill: rainbow)[Balmer], anchor: "south")
  content((9.5, 6.25), text(size: 18pt)[visible], anchor: "north")

  // Paschen series: n >= 4 -> 3 (infrared)
  let paschen-x(idx) = 8.4 + 0.5 * idx
  for (idx, n) in range(4, 7).enumerate() {
    arrow(paschen-x(idx), n, 3, paschen-color)
  }
  content(
    (paschen-x(1), y-of(3) - 0.15),
    text(fill: paschen-color, weight: "bold")[Paschen],
    anchor: "north",
  )
  content(
    (paschen-x(1), y-of(3) - 0.95),
    text(fill: paschen-color, size: 18pt)[IR],
    anchor: "north",
  )
})