Materials Informatics Challenges
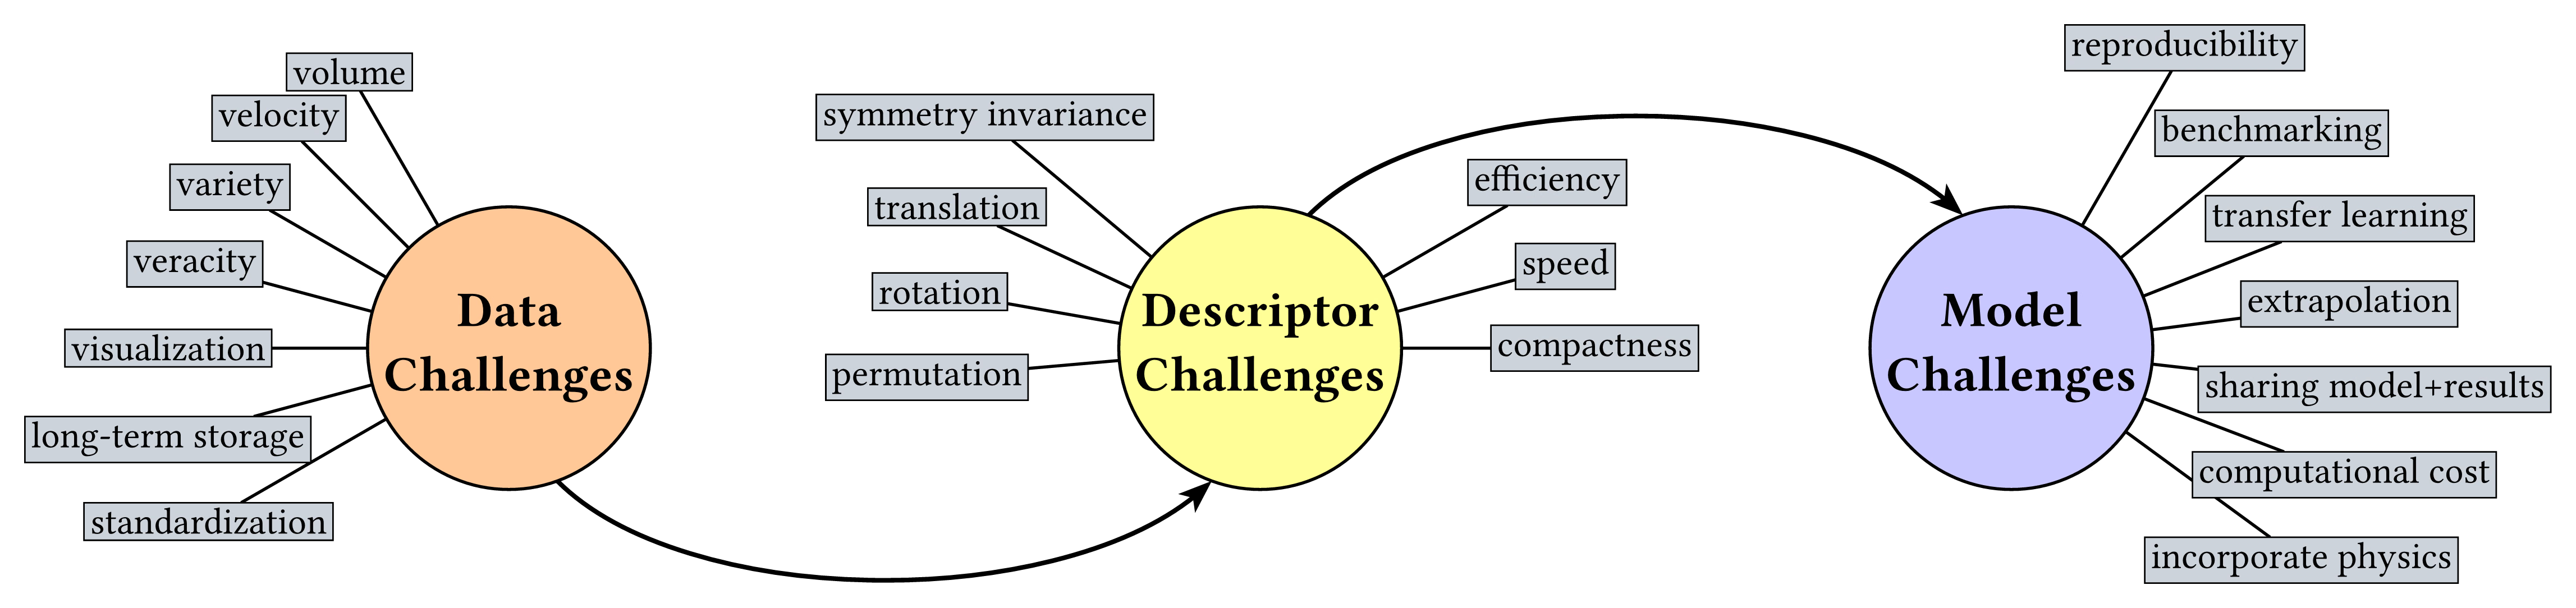
The three stages of a materials-informatics pipeline and what goes wrong at each. Data challenges cover the four Vs of big data (volume, velocity, variety, veracity) plus visualization, standardization and long-term storage. Descriptor challenges are about encoding a structure so the representation respects its symmetry and is invariant under translation, rotation and atom permutation, while staying compact and cheap to compute. Model challenges decide whether a result is usable at all: extrapolation beyond the training data, transfer learning, reproducibility, benchmarking, sharing models and results, computational cost, and building in known physics. Materials Informatics walks through one concrete pipeline of this kind. Inspired by https://tex.stackexchange.com/a/387466.
Download
Code
#import "@preview/cetz:0.5.3": canvas, draw
#import draw: bezier, circle, content, line, on-layer

#set page(width: auto, height: auto, margin: 8pt, fill: none)
#set text(size: 12pt, weight: "bold")

#let (main-r, item-r, spacing) = (1.6, 3.4, 8.5)
// longer labels sit further out so their boxes clear the circle
#let label-radius(item) = item-r + item.len() * 0.035
// Angles that space labels evenly in height between top and bottom (in canvas units), so
// boxes stacked near the circle's top don't crowd while lower ones spread apart.
#let stack(top, bottom, ..items) = {
  let labels = items.pos()
  let step = (top - bottom) / (labels.len() - 1)
  labels
    .enumerate()
    .map(((idx, item)) => (item, calc.asin((top - idx * step) / label-radius(item)) / 1deg))
}

#canvas({
  // (title, color, node name, (item, angle in degrees) pairs), spaced along the x-axis
  let circles = (
    (
      [Data\ Challenges],
      rgb(255, 200, 150),
      "data",
      (
        ("volume", 120),
        ("velocity", 135),
        ("variety", 150),
        ("veracity", 165),
        ("visualization", 180),
        ("long-term storage", 195),
        ("standardization", 210),
      ),
    ),
    (
      [Descriptor\ Challenges],
      rgb(255, 255, 150),
      "descriptor",
      (
        ("symmetry invariance", 140),
        ("translation", 155),
        ("rotation", 170),
        ("permutation", 185),
        ("efficiency", 30),
        ("speed", 15),
        ("compactness", 0),
      ),
    ),
    (
      [Model\ Challenges],
      rgb(200, 200, 255),
      "model",
      stack(
        3.4,
        -2.4,
        "reproducibility",
        "benchmarking",
        "transfer learning",
        "extrapolation",
        "sharing model+results",
        "computational cost",
        "incorporate physics",
      ),
    ),
  )

  for (idx, (title, color, name, items)) in circles.enumerate() {
    circle((idx * spacing, 0), radius: main-r, fill: color, stroke: 1pt, name: name)
    content(name, text(size: 16pt, align(center, title)))
    for (item-idx, (item, angle)) in items.enumerate() {
      content(
        (rel: (angle: angle * 1deg, radius: label-radius(item)), to: name),
        text(weight: "regular", item),
        frame: "rect",
        fill: rgb("#cdd3da"),
        stroke: 0.5pt,
        padding: 2pt,
        radius: 0.03,
        name: name + "-item-" + str(item-idx),
      )
      on-layer(-1, line(name, name + "-item-" + str(item-idx), stroke: 1pt))
    }
  }

  // arrows from data to descriptor (below) and descriptor to model (above)
  for (from, to, direction) in (("data", "descriptor", -1), ("descriptor", "model", 1)) {
    let start = (rel: (angle: direction * 70deg, radius: main-r), to: from)
    let end = (rel: (angle: direction * 110deg, radius: main-r), to: to)
    bezier(
      start,
      end,
      (rel: (1.5, direction * 1.5), to: start),
      (rel: (-1.5, direction * 1.5), to: end),
      stroke: 1.5pt,
      mark: (end: "stealth", scale: 1.2, fill: black),
    )
  }
})