Amplitude vs Frequency Modulation
Creator: Petar Veličković
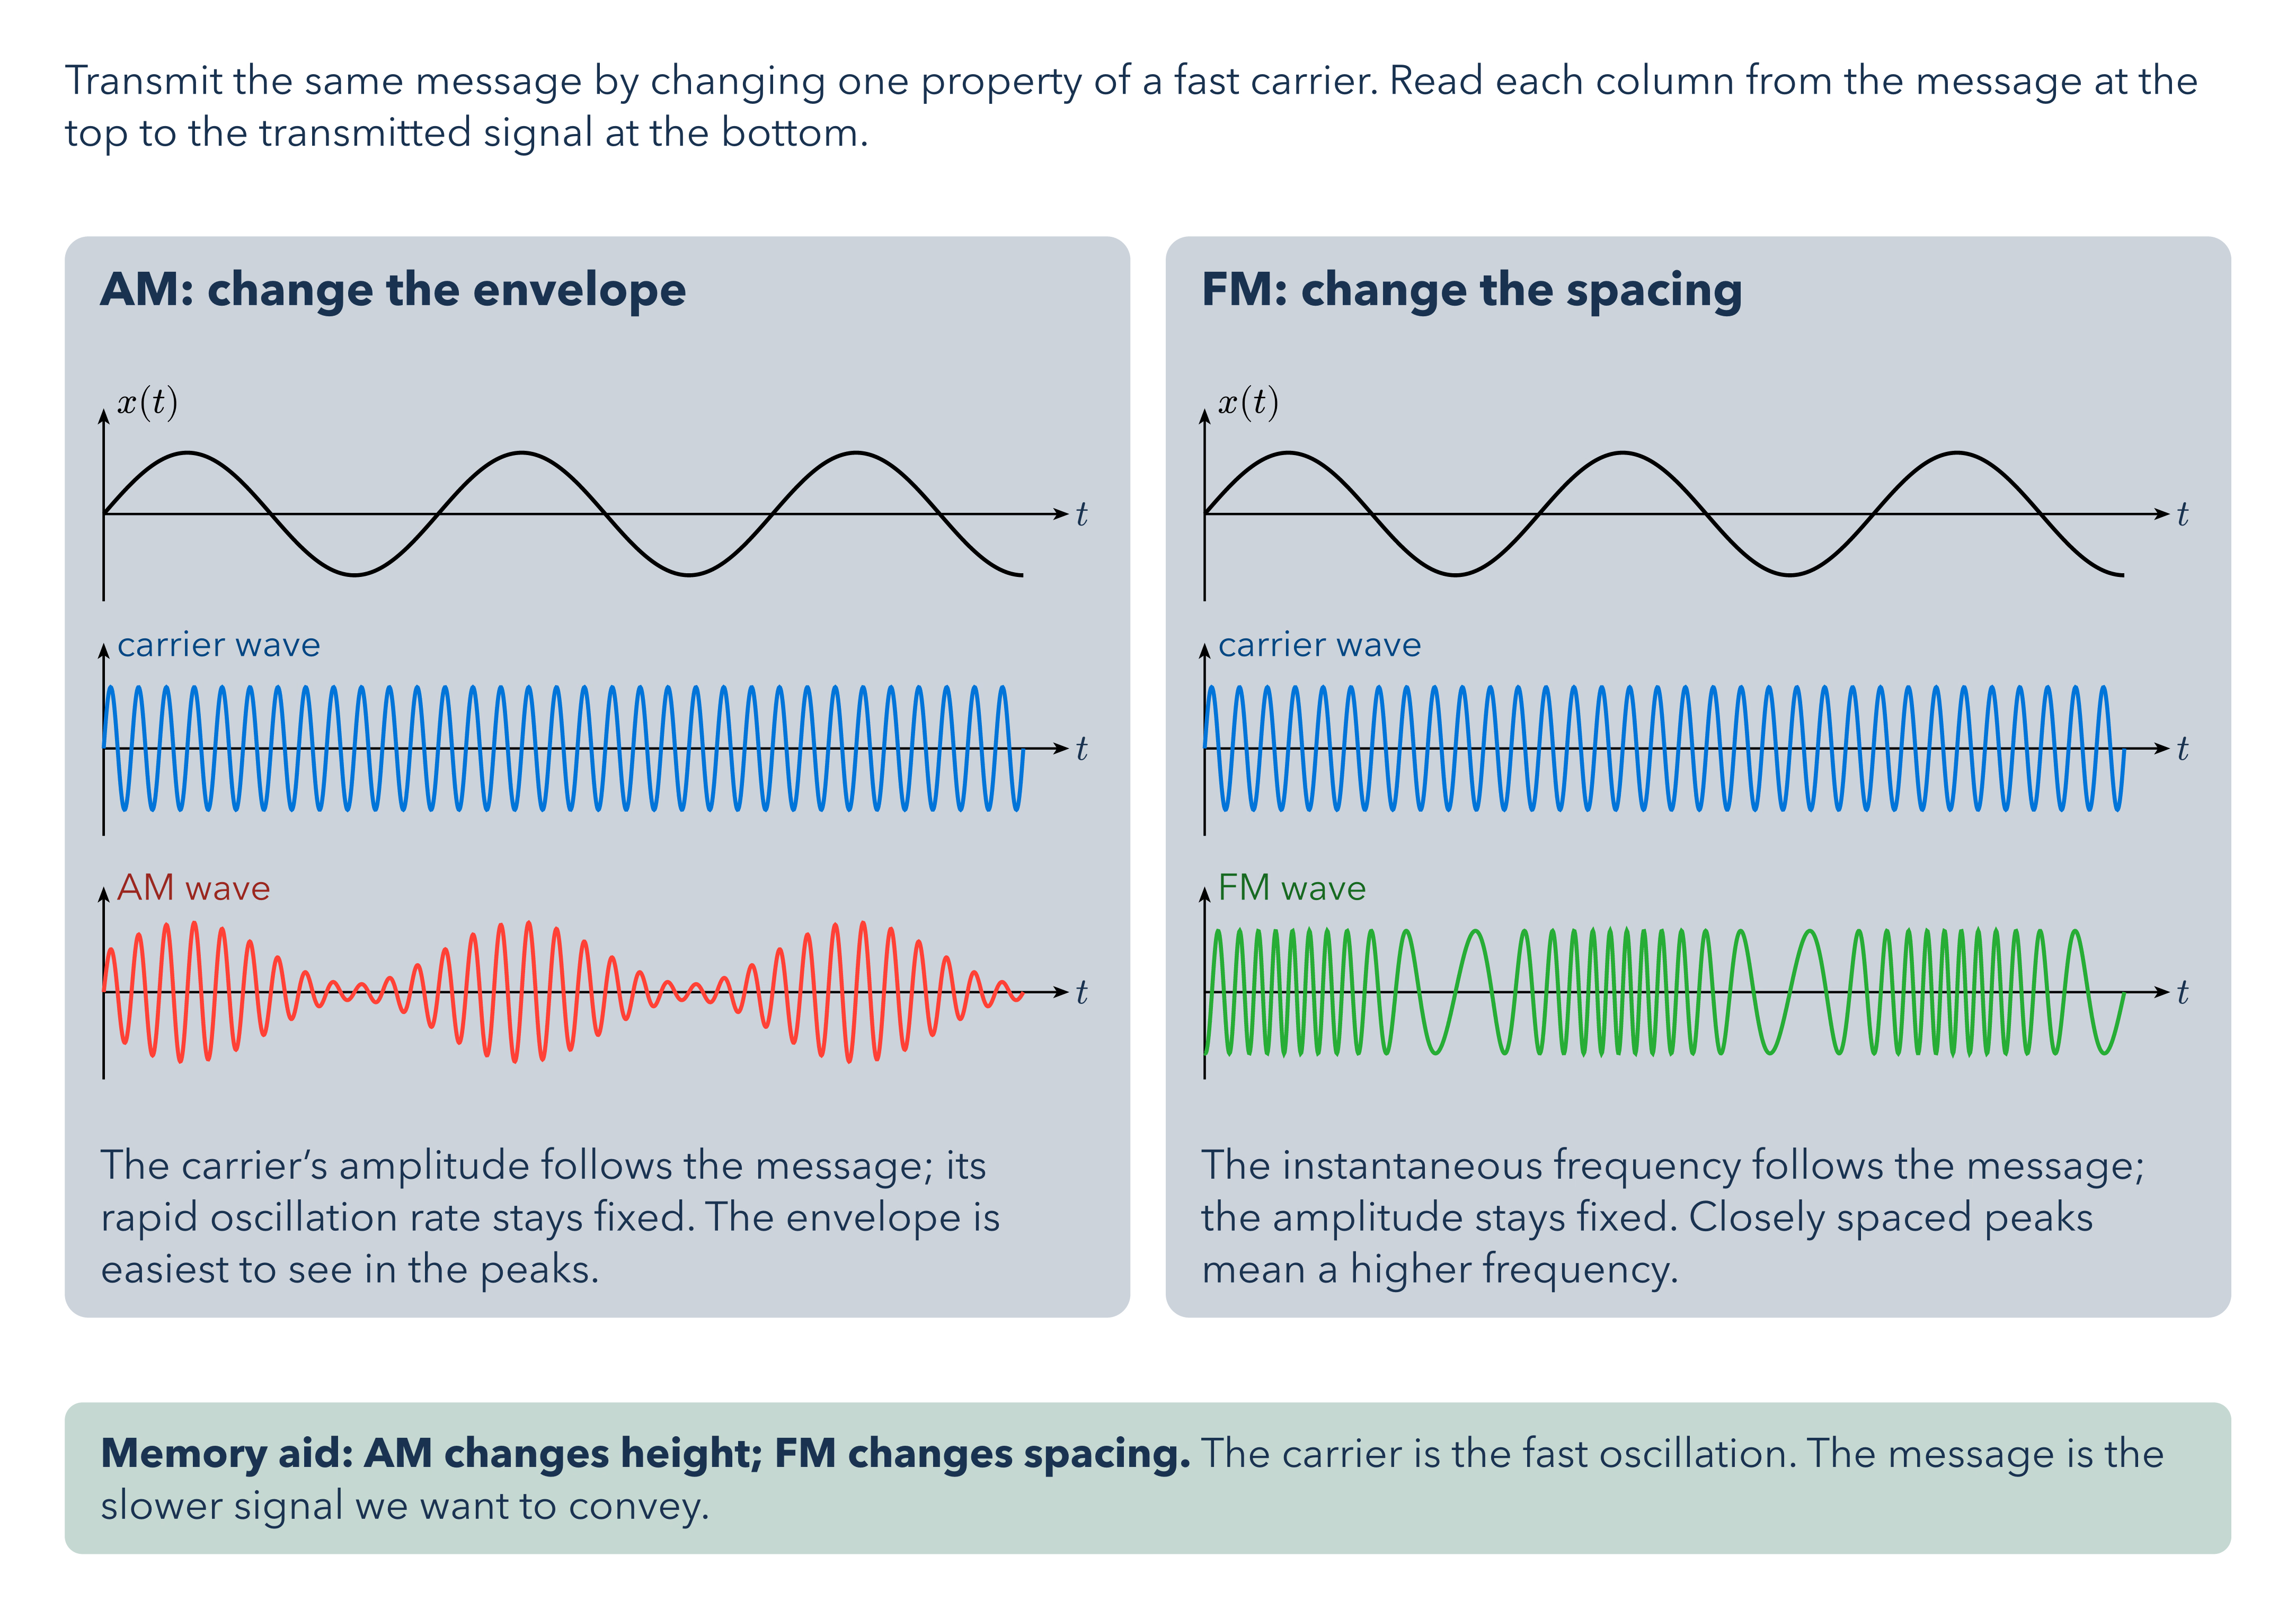
Transmit the same message by changing one property of a fast carrier. Read each column from the message at the top to the transmitted signal at the bottom.
Original illustrations: Amplitude Modulation, Frequency Modulation.
Download
Code
#import "@preview/cetz-plot:0.1.4": plot
#import "@preview/cetz:0.5.3": canvas, draw
#let label-size = 12pt
#let paragraph-size = 14pt
#let heading-size = 16pt

#let card_body(title, body, caption) = block(
  width: 100%,
  inset: 12pt,
  radius: 8pt,
  fill: rgb("#cdd3da"),
  breakable: false,
)[
  #text(size: heading-size, weight: "bold", title)
  #v(8pt)
  // Measure unconstrained artwork before scaling, including content wider than its card.
  #layout(size => {
    let artwork = text(size: label-size, body)
    std.scale(size.width / measure(artwork).width * 100%, reflow: true, artwork)
  })
  #v(7pt)
  #text(size: paragraph-size, caption)
]

#let card-grid(columns: 2, ..cards) = layout(size => {
  let rows = cards
    .pos()
    .chunks(columns)
    .map(row => {
      let ratios = row.map(card => {
        let bounds = measure(text(size: label-size, card.at(1)))
        bounds.width / bounds.height
      })
      let available = size.width - 12pt * (row.len() - 1) - 24pt * row.len()
      grid(
        columns: ratios.map(ratio => 24pt + available * ratio / ratios.sum()),
        gutter: 12pt,
        ..row.map(args => card_body(..args)),
      )
    })
  stack(dir: ttb, spacing: 12pt, ..rows)
})

#let takeaway(body) = block(
  width: 100%,
  inset: 12pt,
  radius: 6pt,
  fill: rgb("#c6d8d2"),
  breakable: false,
  text(size: paragraph-size, body),
)

#set page(width: 780pt, height: auto, margin: 22pt, fill: none)
#set text(font: "Avenir Next", size: paragraph-size, fill: rgb("#19324f"))
#set par(leading: 0.55em)

#let (plot-width, plot-height) = (10.0, 1.6)

// `y` is the height of the panel's t-axis; the curve is shifted so that the zero of
// `y-range` lands on it, which is what lets panels with different scales line up.
#let signal-row(name, y, title, func, color, y-range) = {
  let (y-min, y-max) = y-range
  let arrow = (mark: (end: "stealth", fill: black, scale: .55), stroke: .8pt)
  let (x-axis, y-axis) = (name + "-x-axis", name + "-y-axis")

  draw.line((0, y), (plot-width + .5, y), ..arrow, name: x-axis)
  draw.line((0, y - .95), (0, y + 1.15), ..arrow, name: y-axis)
  draw.content(x-axis + ".end", $t$, anchor: "west", padding: 2pt)
  draw.content(
    (rel: (.14, -.15), to: y-axis + ".end"),
    // Darker than the curve so the label stays legible on the gray card in both themes.
    text(fill: color.darken(40%), title),
    anchor: "south-west",
  )

  draw.group({
    draw.translate((0, y - (0 - y-min) / (y-max - y-min) * plot-height))
    plot.plot(
      size: (plot-width, plot-height),
      axis-style: none,
      y-min: y-min,
      y-max: y-max,
      plot.add(style: (stroke: color + 1.3pt), domain: (0, 1), samples: 1600, func),
    )
  })
}

// Both columns share the message and carrier; only the bottom (modulated) row differs.
#let message(x) = 2 * calc.sin(5.5 * calc.pi * x)
#let carrier(x) = 2 * calc.sin(66 * calc.pi * x)
// AM: scale the carrier by an offset copy of the message.
#let am(x) = (2.5 + message(x)) * carrier(x)
// FM: integrate the message into the carrier phase.
#let fm(x) = 2 * calc.sin(66 * calc.pi * x - 8 * calc.cos(5.5 * calc.pi * x))

#let modulation-figure(name, title, func, color, y-max) = canvas(length: 1.05cm, {
  signal-row("msg", 4.6, $x(t)$, message, black, (-2.4, 2.4))
  signal-row("carrier", 2.05, [carrier wave], carrier, blue, (-2.4, 2.4))
  signal-row(name, -.6, title, func, color, (-y-max, y-max))
})

Transmit the same message by changing one property of a fast carrier. Read each column from the message at the top to the transmitted signal at the bottom.
#v(14pt)
#card-grid(
  (
    [AM: change the envelope],
    modulation-figure("am", [AM wave], am, red, 9.5),
    [The carrier’s amplitude follows the message; its rapid oscillation rate stays fixed. The envelope is easiest to see in the peaks.],
  ),
  (
    [FM: change the spacing],
    modulation-figure("fm", [FM wave], fm, green.darken(15%), 2.4),
    [The instantaneous frequency follows the message; the amplitude stays fixed. Closely spaced peaks mean a higher frequency.],
  ),
)
#v(12pt)
#takeaway[*Memory aid: AM changes height; FM changes spacing.* The carrier is the fast oscillation. The message is the slower signal we want to convey.]