Ball Tree
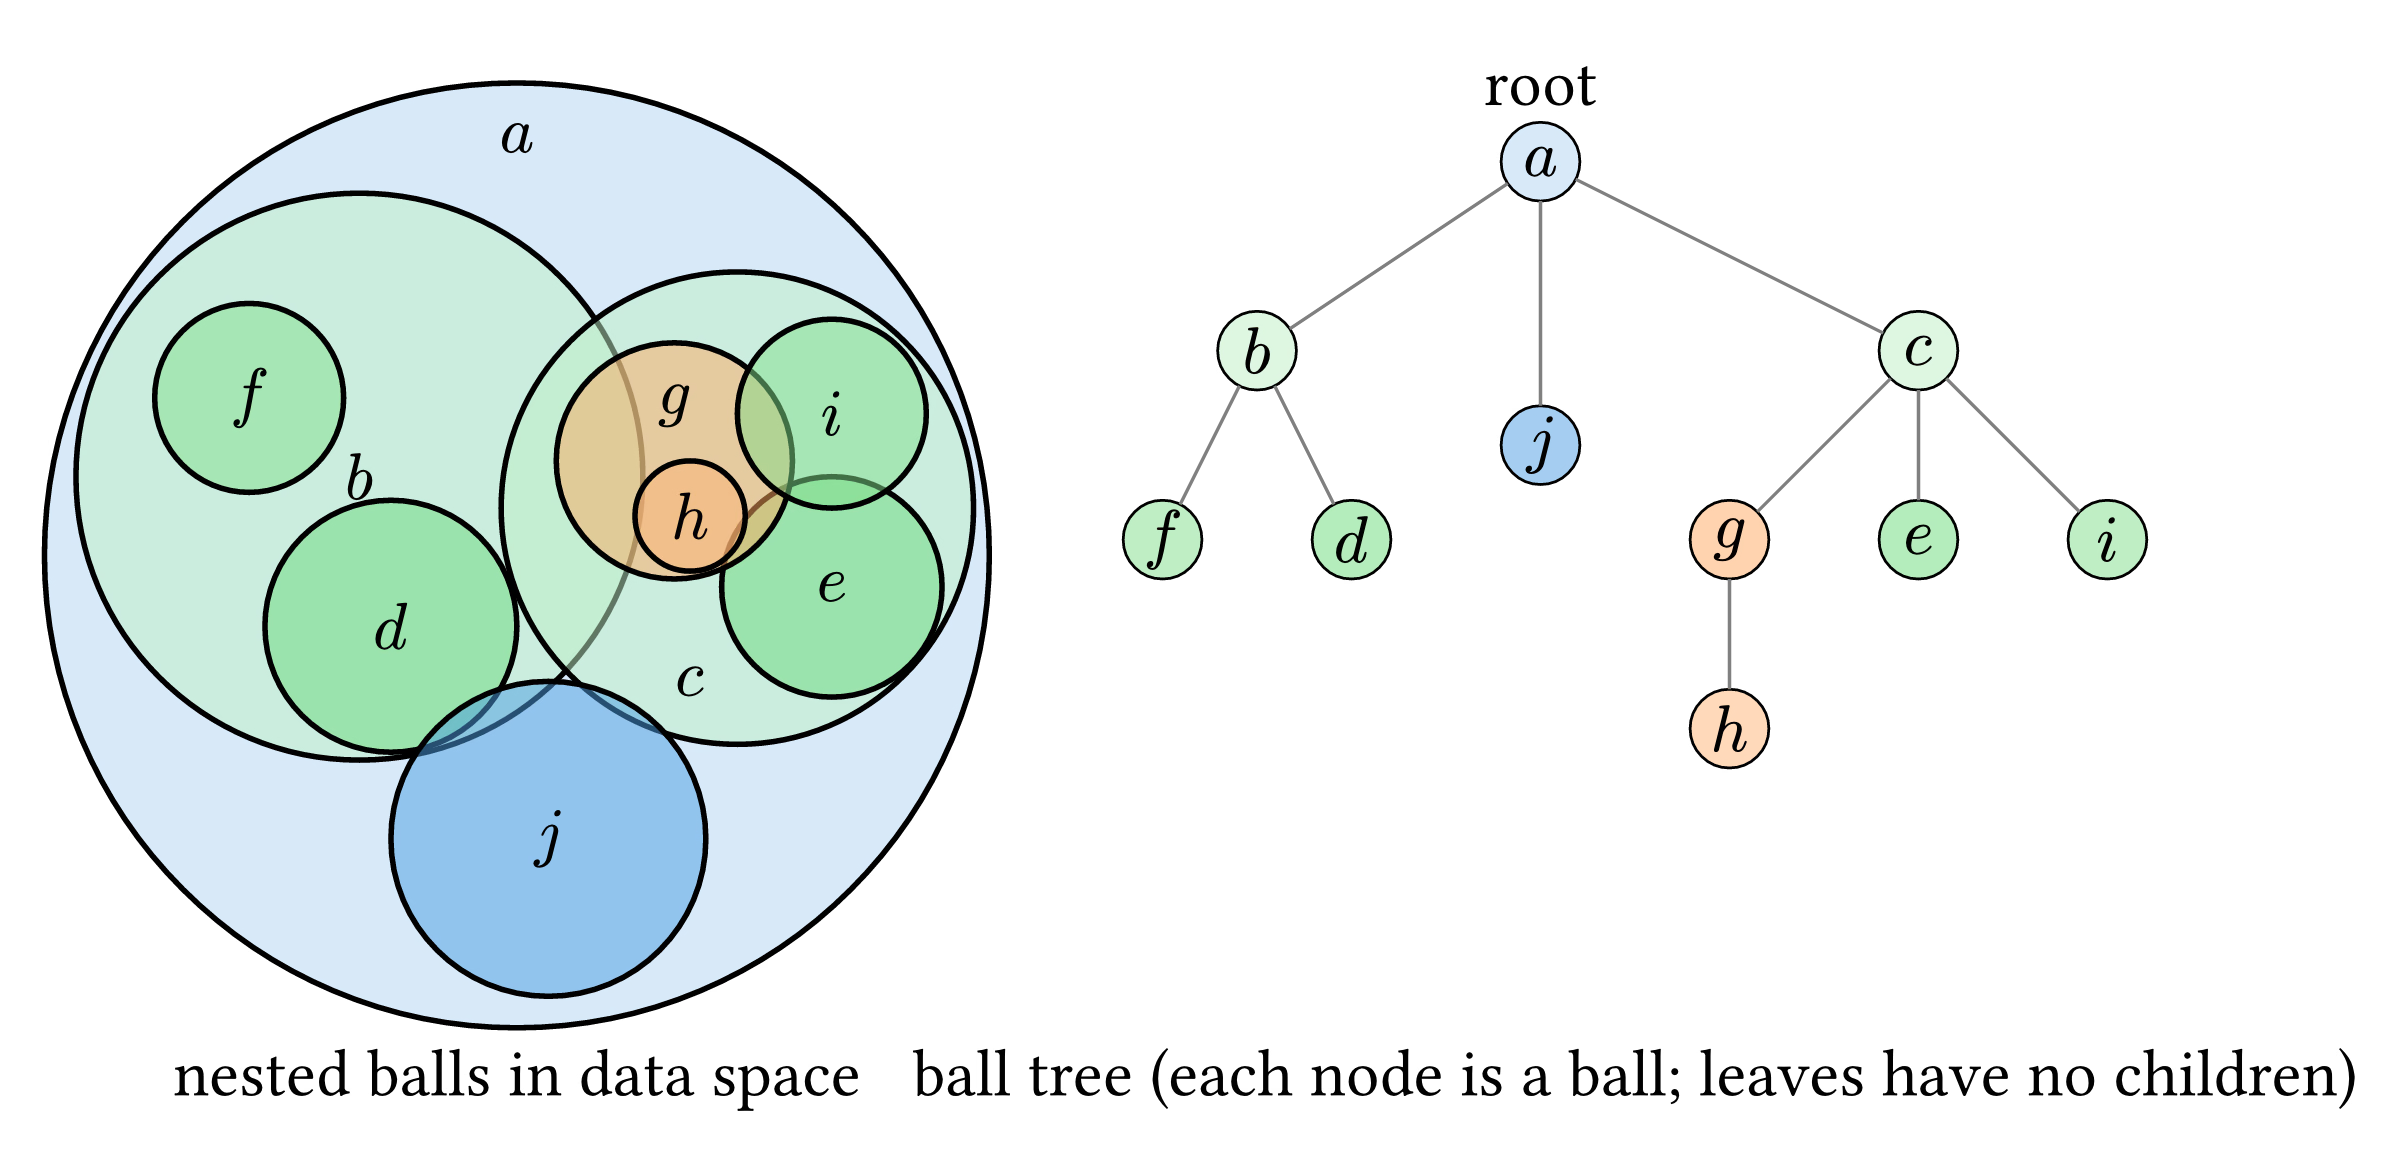
Visualization of the Ball Tree algorithm, a space-partitioning data structure used for efficient nearest neighbor searches, particularly in high-dimensional spaces.
The left side illustrates the hierarchical partitioning of a dataset into nested hyperspheres (balls). Each ball represents a region of the space containing a subset of data points.
The right side shows the corresponding tree structure where each node represents a ball. Internal nodes represent larger balls encompassing the balls of their children, while leaf nodes contain the actual data points.
This hierarchical structure allows the search algorithm to prune large portions of the data space by comparing the query point's distance to the ball's center and radius, making it faster than exhaustive search, especially for high-dimensional non-uniformly distributed data.
Download
Code
#import "@preview/cetz:0.5.3": canvas, draw
#import draw: circle, content, line

#set page(width: auto, height: auto, margin: 8pt, fill: none)
#set text(size: 12pt)

// eval keeps the letter an italic math variable; $#label$ would set it upright
#let node-label(label) = eval(label, mode: "math")

#canvas({
  let shade(color, lighten) = color.lighten(lighten).transparentize(50%)
  let node-colors = (
    a: shade(blue, 70%),
    b: shade(green, 70%),
    c: shade(green, 70%),
    d: shade(green, 30%),
    e: shade(green, 30%),
    f: shade(green, 40%),
    g: shade(orange, 30%),
    h: shade(orange, 40%),
    i: shade(green, 40%),
    j: shade(blue, 30%),
  )

  // The nested balls, drawn parent first so children sit on top. Every ball is placed
  // relative to a neighbor purely for convenience; containment is what the tree encodes.
  // Labels of a, c and g are shifted off-center where no child ball covers them.
  for (label, anchor, offset, radius, label-offset) in (
    ("a", none, (-3, 0), 3.0, (0, 2.65)),
    ("b", "a", (-1.0, 0.5), 1.8, (0, 0)),
    ("c", "a", (1.4, 0.3), 1.5, (-0.3, -1.1)),
    ("d", "b", (0.2, -0.95), 0.8, (0, 0)),
    ("e", "c", (0.6, -0.5), 0.7, (0, 0)),
    ("f", "b", (-0.7, 0.5), 0.6, (0, 0)),
    ("g", "c", (-0.4, 0.3), 0.75, (0, 0.35)),
    ("h", "g", (0.1, -0.35), 0.35, (0, 0)),
    ("i", "e", (0.0, 1.1), 0.6, (0, 0)),
    ("j", "a", (0.2, -1.8), 1.0, (0, 0)),
  ) {
    let name = "circ-" + label
    let pos = if anchor == none { offset } else { (rel: offset, to: "circ-" + anchor) }
    circle(pos, radius: radius, fill: node-colors.at(label), name: name)
    content((rel: label-offset, to: name), node-label(label))
  }

  // Tree structure on the right
  for (label, dx, dy) in (
    ("a", 0, 0),
    ("b", -1.5, -1),
    ("c", 2.0, -1),
    ("j", 0, -1.5),
    ("f", -2.0, -2),
    ("d", -1.0, -2),
    ("g", 1.0, -2),
    ("e", 2.0, -2),
    ("i", 3.0, -2),
    ("h", 1.0, -3),
  ) {
    let pos = (3.5 + dx * 1.2, 2.5 + dy * 1.2)
    circle(pos, radius: 0.25, fill: node-colors.at(label), stroke: 0.5pt, name: "node-" + label)
    content(pos, node-label(label))
  }

  for (parent, child) in (
    ("a", "b"),
    ("a", "c"),
    ("a", "j"),
    ("b", "f"),
    ("b", "d"),
    ("c", "g"),
    ("c", "e"),
    ("c", "i"),
    ("g", "h"),
  ) {
    line("node-" + parent, "node-" + child, stroke: (paint: rgb("#808080"), thickness: 0.6pt))
  }

  content("node-a.north", [root], anchor: "south", padding: 3pt)
  content((-3, -3.15), [nested balls in data space], anchor: "north")
  content(
    (3.5 + 0.5 * 1.2, -3.15),
    [ball tree (each node is a ball; leaves have no children)],
    anchor: "north",
  )
})