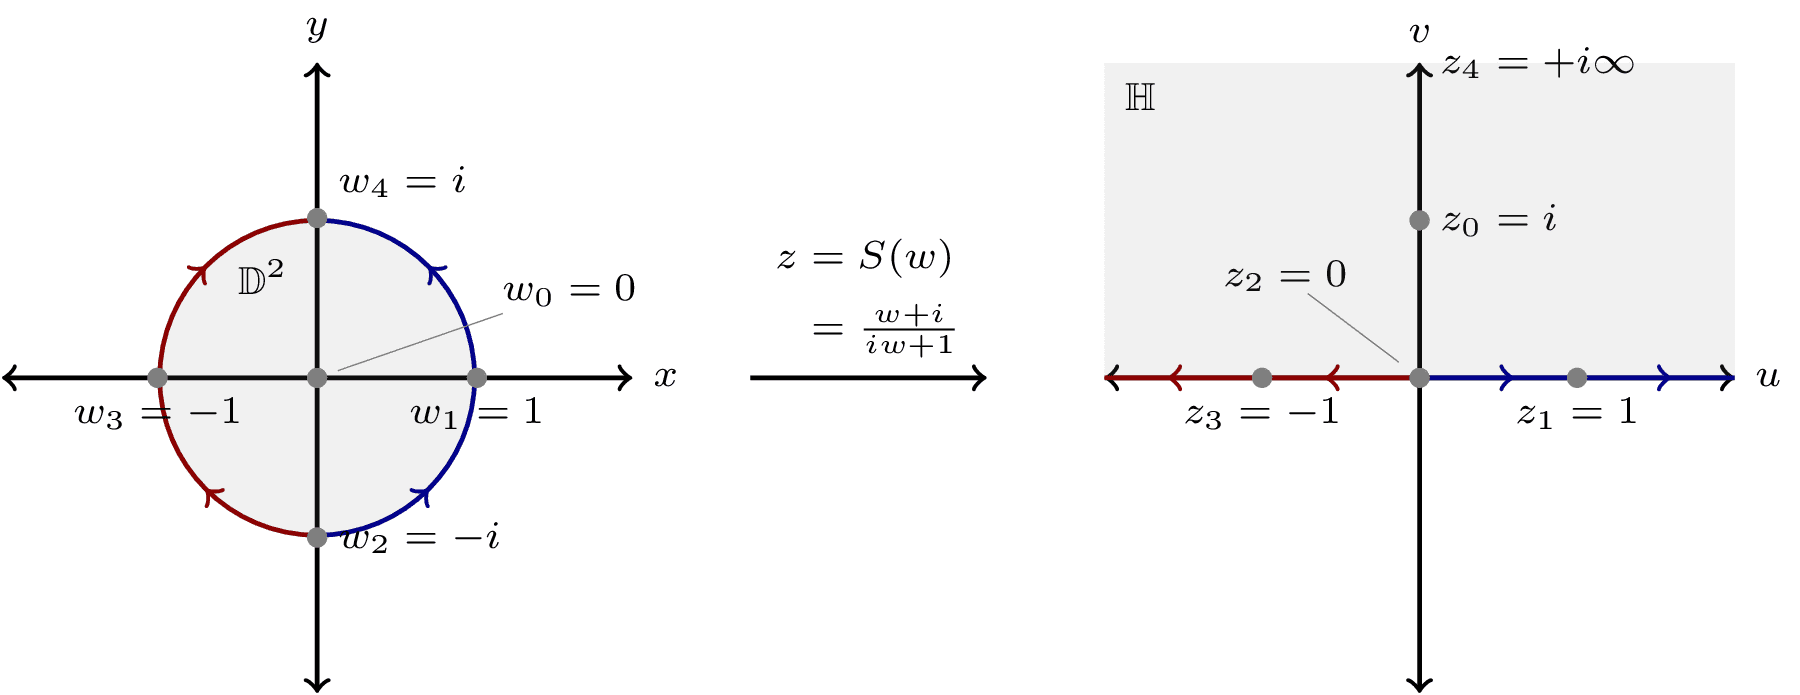
Visualization of the Cayley transform S(w) = (w+i)/(iw+1) mapping the unit disk (D²) to the upper half-plane (H). The diagram shows how points and paths are mapped between these domains, with special points labeled. This conformal transformation is useful in string theory and conformal field theory, where calculations are often simpler in one domain than the other.
\documentclass[tikz,svgnames]{standalone}
\usepackage{amsmath,amssymb}
\usetikzlibrary{decorations.markings}
\begin{document}
\begin{tikzpicture}[
thick, font = \scriptsize,
circ/.style ={circle, fill = gray, draw = gray, inner sep = 1pt}
]
\def\yaxis{2}
\draw [<->] (-2, 0) -- (2, 0) node (from)[anchor = west]{$x$};
\draw [<->] (0, -\yaxis) -- (0, \yaxis) node [anchor = south]{$y$};
\draw [->] (from) (2.75,0) --++(0:1.5) node [anchor = south, midway]{$\begin{aligned}
z & = S(w) \\
& =\textstyle \frac{w + i}{i w + 1}
\end{aligned}$};
\node (CI) at (0, 0) [circ, fill = gray, opacity = 0.1, minimum size = \yaxis cm]{};
\begin{scope}[decoration={
markings,
mark=at position 0.25 with {\arrow{>}},
mark=at position 0.75 with {\arrow{>}}}
]
\draw[DarkBlue,postaction={decorate}] (0,-1) arc (-90:90:1);
\draw[DarkRed,postaction={decorate}] (0,-1) arc (270:90:1);
\end{scope}
\node [pin={[pin distance=30,inner sep=1pt]20:$w_0 = 0$}] {};
\node at (CI.east) [anchor = north] {$w_1 = 1$};
\node at (CI.south) [anchor = west] {$w_2 = -i$};
\node at (CI.west) [anchor = north] {$w_3 = -1$};
\node at (CI.north) [anchor = south west] {$w_4 = i$};
\node at (CI.110) [anchor = north east, below = 2pt]{$\mathbb{D}^2$};
\foreach \x in {west, center, east, south, north}{
\node [circ] at (CI.\x) {};
};
\begin{scope}[xshift = 7cm]
\draw [<->] (-\yaxis, 0) -- (\yaxis, 0) node [anchor = west,text = black]{$u$};
\draw [<->] (0, -\yaxis) -- (0, \yaxis) node [anchor = south] {$v$};
\begin{scope}[decoration={
markings,
mark=at position 0.3 with {\arrow{>}},
mark=at position 0.8 with {\arrow{>}}}
]
\draw[DarkRed,postaction={decorate}] (0,0) -- (-2,0);
\draw[DarkBlue,postaction={decorate}] (0,0) -- (2,0);
\end{scope}
\node at (0,1) [anchor = west]{$z_0 = i$};
\node at (1,0) [anchor = north]{$z_1 = 1$};
\node [pin={[pin distance=15,inner sep=0pt]130:$z_2 = 0$}] {};
\node at (-1,0) [anchor = north]{$z_3 = -1$};
\node at (0,2) [anchor = west]{$z_4 = +i \infty$};
\node at (0, 1) [circ]{};
\foreach \x in {-1, 0, 1}{
\node at (\x, 0) [circ]{};
}
\fill [fill = gray, opacity = 0.1] (-2, 0) rectangle (2, 2);
\node at (-2, 2) [anchor = north west]{$\mathbb{H}$};
\end{scope}
\end{tikzpicture}
\end{document}
#import "@preview/cetz:0.3.4": canvas, draw
#import draw: circle, line, content, arc, rect
#set page(width: auto, height: auto, margin: 8pt)
#let radius = 1
#let axis-length = 2.5
#let arrow-sep = 3.5
#let arrow-width = 1.5
#let x-shift = 8.5
#let dot-style = (fill: gray, radius: 0.08, stroke: none)
#let arrow-style = (
mark: (end: "stealth", fill: black, scale: 0.7),
stroke: 0.8pt,
)
#let arc-arrow = (
mark: (
end: (
(pos: 25%, symbol: "barbed", fill: none, scale: 0.7),
(pos: 75%, symbol: "barbed", fill: none, scale: 0.7),
),
),
stroke: 0.8pt,
)
#canvas({
// Left coordinate system (disk)
line((-axis-length, 0), (axis-length, 0), ..arrow-style, name: "x-axis")
content("x-axis.end", $x$, anchor: "west", padding: (0, 3pt, 2pt))
line((0, -axis-length), (0, axis-length), ..arrow-style, name: "y-axis")
content("y-axis.end", $y$, anchor: "south", padding: (0, 3pt, 2pt))
// Transformation arrow and label
line((arrow-sep, 0), (arrow-sep + arrow-width, 0), ..arrow-style, name: "transform-arrow")
content(
(rel: (0, 0), to: "transform-arrow.mid"),
$z &= S(w)\ &= (w + i) / (i w + 1)$,
anchor: "south",
padding: 4pt,
)
// Unit disk with gray fill
circle((0, 0), radius: radius, stroke: 0.8pt, fill: rgb(220, 220, 220).transparentize(60%), name: "disk")
content((rel: (-0.4, 0.5), to: "disk.center"), $DD^2$)
// Dots at special points
circle((0, 0), ..dot-style, name: "w0")
circle((radius, 0), ..dot-style, name: "w1")
circle((0, -radius), ..dot-style, name: "w2")
circle((-radius, 0), ..dot-style, name: "w3")
circle((0, radius), ..dot-style, name: "w4")
// Labels for points
content((rel: (2, 1), to: "w0"), $w_0 = 0$, name: "w0-label")
line("w0-label", "w0", stroke: gray + 0.5pt)
content((rel: (0.3, -0.3), to: "w1"), $w_1 = 1$)
content((rel: (.8, -0.2), to: "w2"), $w_2 = -i$)
content((rel: (-0.2, -0.3), to: "w3"), $w_3 = -1$)
content((rel: (0.2, 0.3), to: "w4"), $w_4 = i$, anchor: "west")
// Blue and red semicircles with arrows at 0.25 and 0.75
arc(
(-radius, 0),
radius: radius,
start: 270deg,
stop: 90deg,
stroke: blue + 1.2pt,
anchor: "arc-center",
mark: (
end: (
(pos: 25%, symbol: "barbed", fill: blue, scale: 0.7, shorten-to: none),
(pos: 75%, symbol: "barbed", fill: blue, scale: 0.7, shorten-to: none),
),
),
name: "blue-arc",
)
arc(
(radius, 0),
radius: radius,
start: -90deg,
stop: 90deg,
stroke: red + 0.8pt,
anchor: "arc-center",
mark: (
end: (
(pos: 25%, symbol: "barbed", fill: red, scale: 0.7, shorten-to: none),
(pos: 75%, symbol: "barbed", fill: red, scale: 0.7, shorten-to: none),
),
),
name: "red-arc",
)
// Right coordinate system (upper half-plane)
line((x-shift - axis-length, 0), (x-shift + axis-length, 0), ..arrow-style, name: "u-axis")
content("u-axis.end", $u$, anchor: "west", padding: 2pt)
line((x-shift, -axis-length), (x-shift, axis-length), ..arrow-style, name: "v-axis")
content("v-axis.end", $v$, anchor: "south", padding: 2pt)
// Extend blue and red lines to full width
line(
(x-shift, 0),
(x-shift + axis-length, 0),
stroke: blue + 1.2pt,
mark: (
end: (
(pos: 25%, symbol: "barbed", fill: blue, scale: 0.7, shorten-to: none),
(pos: 75%, symbol: "barbed", fill: blue, scale: 0.7, shorten-to: none),
),
),
name: "pos-real-line",
)
line(
(x-shift, 0),
(x-shift - axis-length, 0),
stroke: red + 1.2pt,
mark: (
end: (
(pos: 25%, symbol: "barbed", fill: red, scale: 0.7, shorten-to: none),
(pos: 75%, symbol: "barbed", fill: red, scale: 0.7, shorten-to: none),
),
),
name: "neg-real-line",
)
// Upper half-plane with gray fill
rect(
(x-shift - axis-length, 0),
(x-shift + axis-length, axis-length),
stroke: none,
fill: rgb(220, 220, 220).transparentize(60%),
name: "plane",
)
content("plane.north-west", $HH$, anchor: "north-west", padding: 4pt)
// Dots at special points
circle((x-shift, radius), ..dot-style, name: "z0")
circle((x-shift + radius, 0), ..dot-style, name: "z1")
circle((x-shift, 0), ..dot-style, name: "z2")
circle((x-shift - radius, 0), ..dot-style, name: "z3")
// Labels for points
content((rel: (0.2, 0), to: "z0"), $z_0 = i$, anchor: "west")
content((rel: (0, -0.4), to: "z1"), $z_1 = 1$)
content((rel: (-1, 0.8), to: "z2"), $z_2 = 0$, name: "z2-label")
content((rel: (0, -0.4), to: "z3"), $z_3 = -1$)
content((rel: (0.2, -0.2), to: "v-axis.end"), $z_4 = +i infinity$, anchor: "west")
line("z2-label", "z2", stroke: gray + 0.5pt)
})