« home

Gas Pressure on Wall

physicsthermodynamicsundergradexercisecetztikz

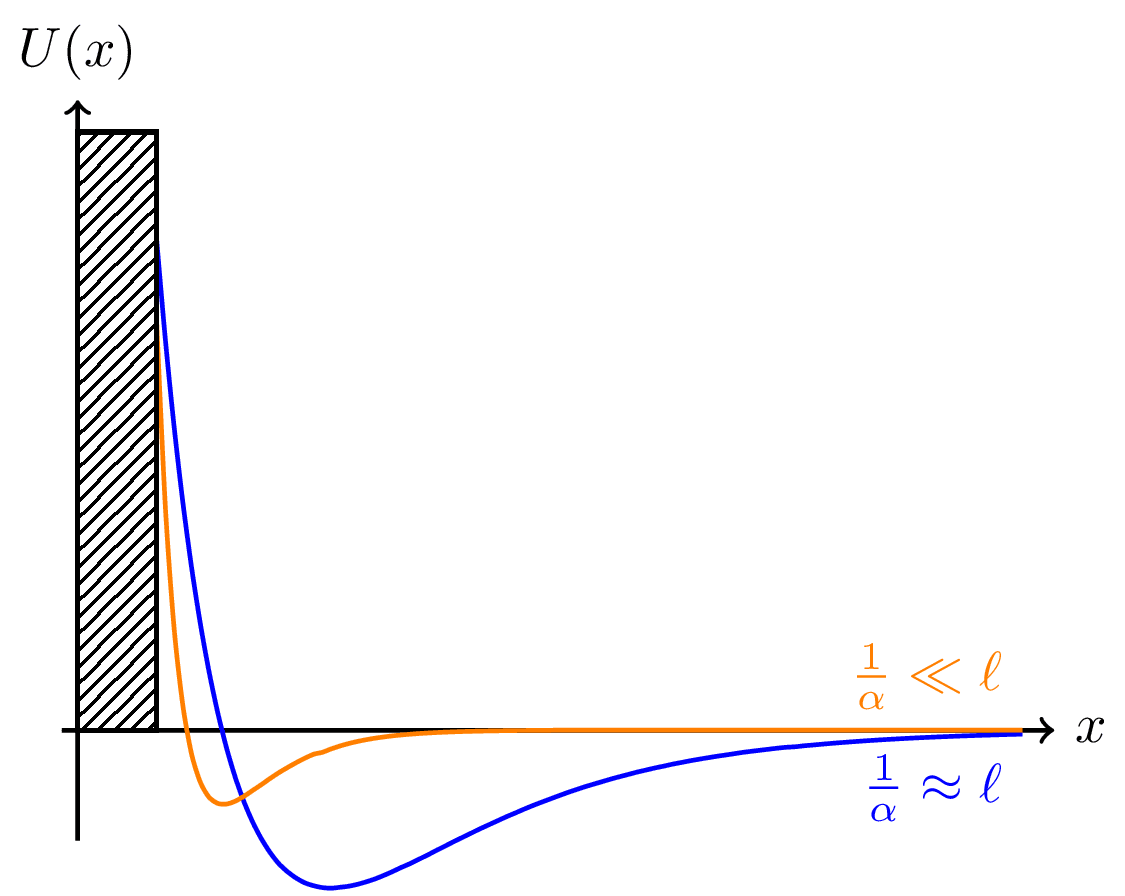
Exercise illustration: Compute the pressure of an ideal gas in three dimensions upon a wall at x=0x = 0 that attracts molecules at large distance and repels them at smaller distance. Let the force be given by the potential U(x)=Aeαx+Be2αxU(x) = -A \, e^{-\alpha x} + B \, e^{-2 \alpha x}, with A,B>0A,B > 0.


Gas Pressure on Wall

  Download

PNGPDFSVG

  Code

  LaTeX

gas-pressure-on-wall.tex (27 lines)

\documentclass[tikz,border={0 1}]{standalone}

\usetikzlibrary{patterns,decorations.markings,backgrounds}

\begin{document}
\begin{tikzpicture}[thick]

  % Axes
  \def\xmin{-0.1}\def\xmax{6}
  \def\ymin{-0.7}\def\ymax{4}
  \draw[->] (\xmin,0) -- (\xmax+0.2,0) node[right] {$x$};
  \draw[->] (0,\ymin) -- (0,\ymax) node[above] {$U(x)$};

  % Potential
  \def\wall{0.5}
  \def\U{-\A*e^(-\a*\x) + \B*e^(-2*\a*\x)}
  \def\A{10}\def\B{25}\def\a{1}
  \draw[domain=\wall:\xmax,smooth,samples=100,blue] plot ({\x},{\U}) node [below left] {$\frac{1}{\alpha} \approx \ell$};
  \def\A{15}\def\B{120}\def\a{3}
  \draw[domain=\wall:\xmax,smooth,samples=100,orange] plot ({\x},{\U}) node [above left] {$\frac{1}{\alpha} \ll \ell$};

  % Wall
  \draw[pattern=north east lines] (0,0) rectangle (\wall,\ymax-0.2);

\end{tikzpicture}
\end{document}

  Typst

gas-pressure-on-wall.typ (78 lines)

#import "@preview/cetz:0.3.2": canvas, draw
#import "@preview/modpattern:0.1.0": modpattern

#set page(width: auto, height: auto, margin: 8pt)

#let hatched = modpattern(
  (.2cm, .2cm),
  std.line(start: (0%, 100%), end: (100%, 0%), stroke: 0.5pt),
)

#let lennard-jones(x, A, B, alpha) = {
  -A * calc.exp(-alpha * x) + B * calc.exp(-2 * alpha * x)
}

#canvas({
  import draw: line, content, rect, on-layer

  let arrow-style = (mark: (end: ">", fill: black, scale: 0.7))
  let wall-width = 0.5

  // Draw axes
  line((-0.1, 0), (6.2, 0), ..arrow-style, name: "x-axis")
  line((0, -0.7), (0, 4), ..arrow-style, name: "y-axis")

  // Add axis labels
  content((rel: (-0.2, 0.3), to: "x-axis.end"), $x$, name: "x-label")
  content((rel: (0.5, 0), to: "y-axis.end"), $U(x)$, name: "y-label")

  // Draw wall with hatching
  on-layer(
    1, // draw wall above pressure lines
    rect(
      (0, 0),
      (wall-width, 3.6),
      fill: hatched,
      pattern: "north-east-lines",
      stroke: 0.75pt,
    ),
  )

  // Draw potential curves
  let samples = 100
  let dx = (6 - wall-width) / samples

  // First curve (blue)
  let (A1, B1, alpha1) = (10, 25, 1)

  for ii in range(samples - 1) {
    let x1 = wall-width + ii * dx
    let x2 = x1 + dx
    let y1 = lennard-jones(x1, A1, B1, alpha1)
    let y2 = lennard-jones(x2, A1, B1, alpha1)
    line(
      (x1, y1),
      (x2, y2),
      stroke: blue,
    )
  }
  content((4.2, -0.6), text(fill: blue)[$1 / alpha << ell$], name: "alpha-label")

  // Second curve (orange)
  let (A2, B2, alpha2) = (15, 120, 3)

  for ii in range(samples - 1) {
    let x1 = wall-width + ii * dx
    let x2 = x1 + dx
    let y1 = lennard-jones(x1, A2, B2, alpha2)
    let y2 = lennard-jones(x2, A2, B2, alpha2)
    line(
      (x1, y1),
      (x2, y2),
      stroke: orange,
      name: "orange-line-" + str(ii),
    )
  }
  content((4.2, 0.4), text(fill: orange)[$1 / alpha << ell$], name: "alpha-label")
})