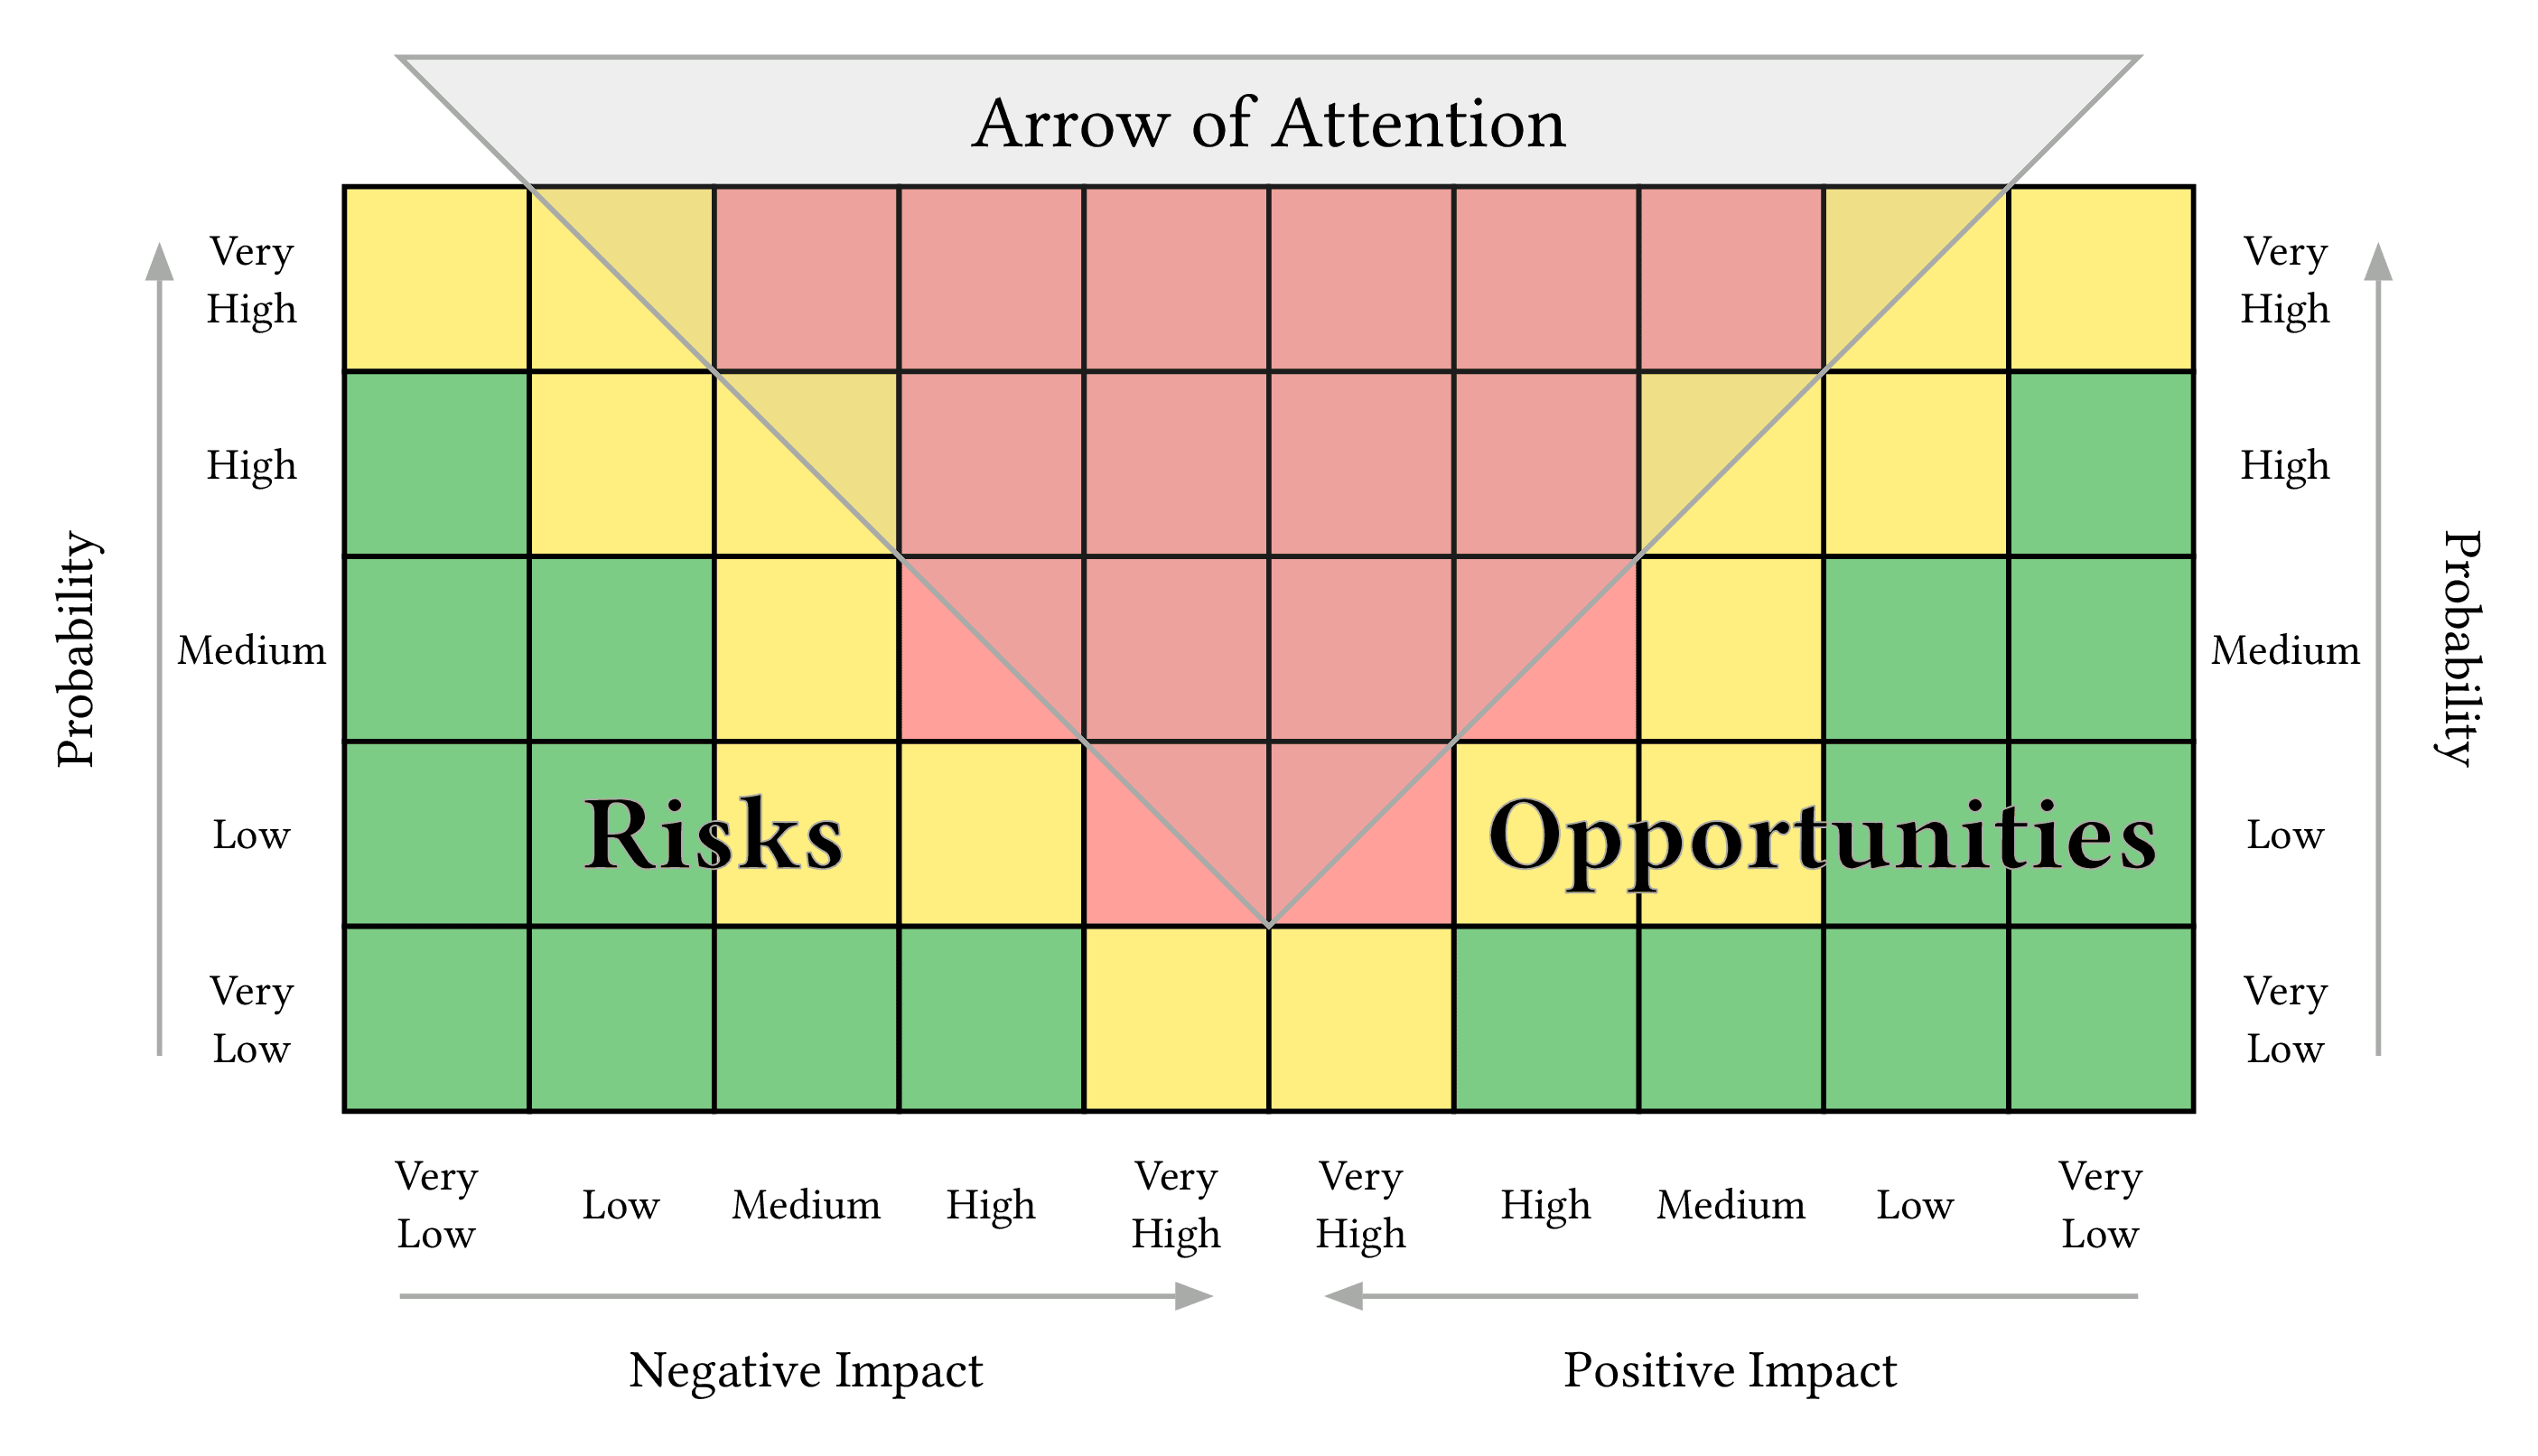
Risk-Opportunity Matrix
Creator: Clemens Koza (original)
The risk/opportunity matrix is a visual tool used in risk management for prioritizing actions based on the likelihood (probability) and potential impact of identified risks and opportunities. It typically plots probability on the Y-axis and impact on the X-axis. The matrix is divided into two mirrored halves: one for risks (negative impact) and one for opportunities (positive impact). Items falling into high-probability, high-impact areas (often colored red or orange) require the most urgent attention, while those in low-probability, low-impact areas (often green) require less immediate focus. This version is adapted from Roland Wanner, featuring a 5x5 grid for both risks and opportunities and an "Arrow of Attention" highlighting the highest priority zones.

Download
Code
risk-opportunity-matrix.typ (126 lines)