θ-β-M Diagram
Creator: Philipp Dobler (original)
In supersonic flow shock waves can occur due to small disturbances of the flow. A θ-β-M Diagram shows the relations between the deflection angle θ, the shock angle β and the Mach number M for an oblique shock.
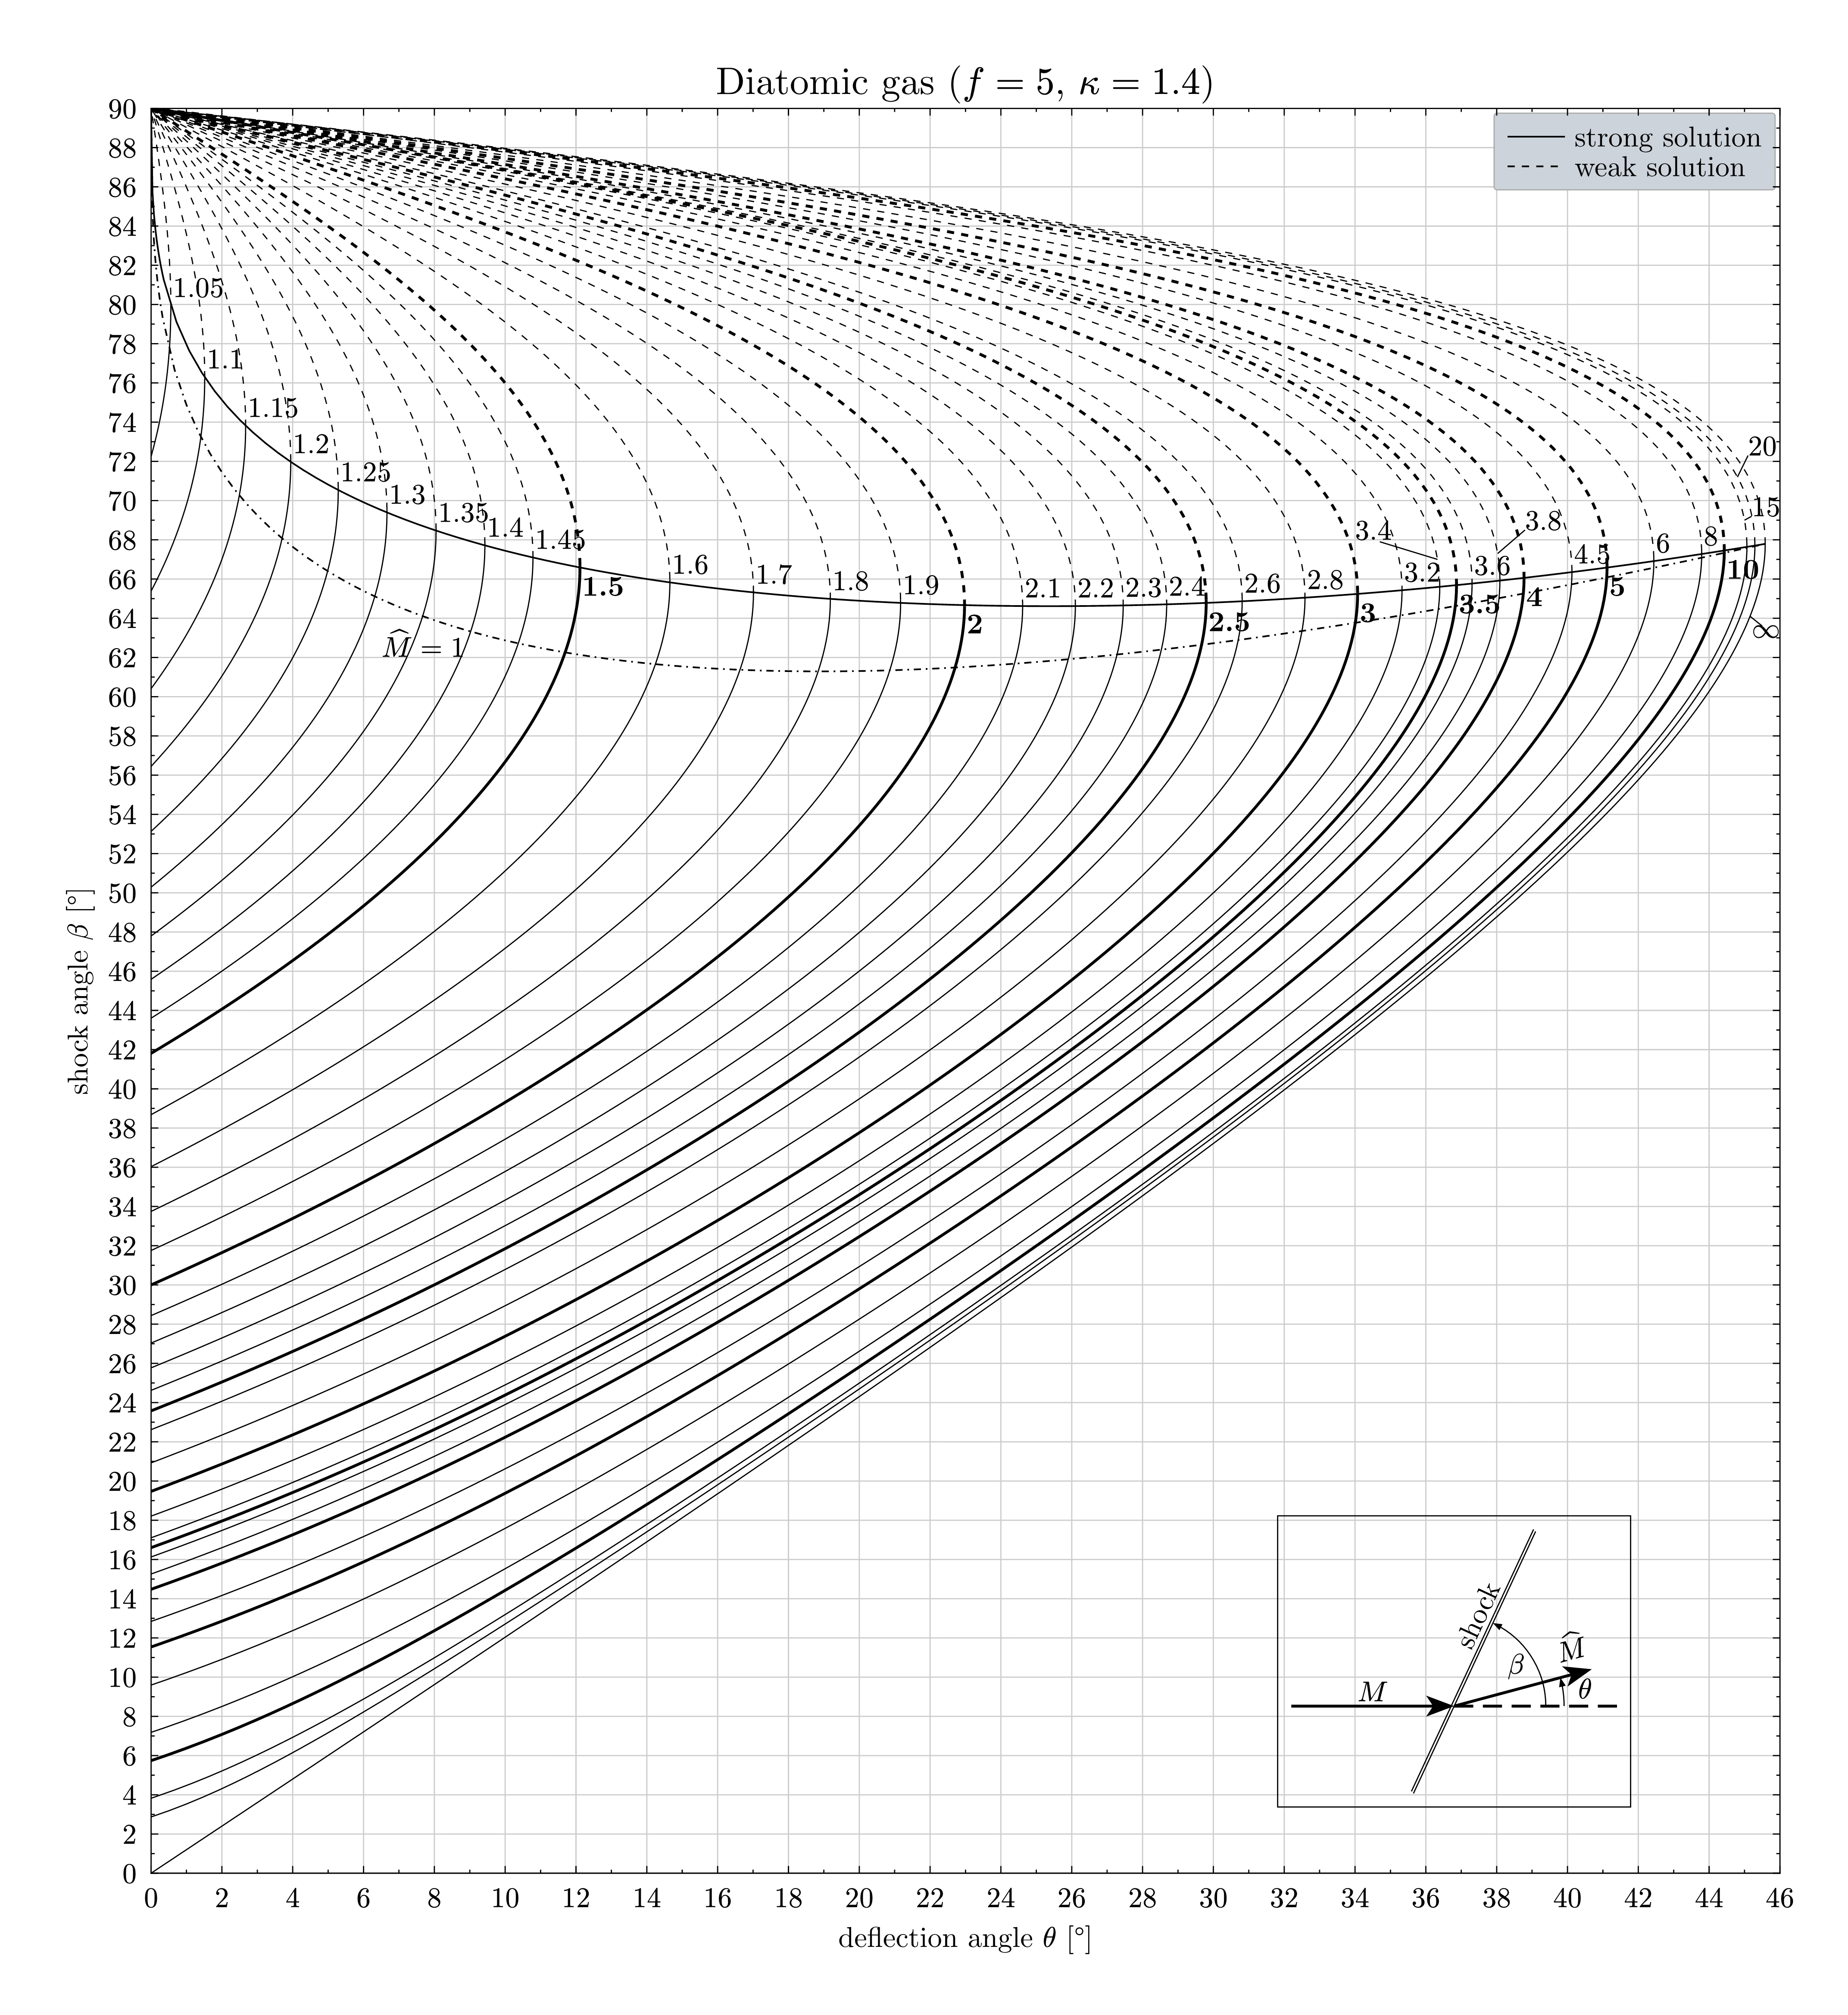
Download
Code
theta-beta-m-diagram.typ (388 lines)
#import "@preview/cetz:0.5.2"
#import cetz.draw: content, line, set-style
#import "@preview/epsilon:0.1.0": secant
#import "@preview/lilaq:0.4.0" as lq

#set text(size: 12pt)

#{
  let KAPPA = 1.4

  /// Find the maximum of a function in a given interval.
  let golden-section-search(f, a, b, tolerance: 1e-7) = {
    let phi-inv = (calc.sqrt(5) - 1) / 2
    while b - a > tolerance {
      let c = b - (b - a) * phi-inv
      let d = a + (b - a) * phi-inv
      if f(c) > f(d) { b = d } else { a = c }
    }
    (b + a) / 2
  }

  /// Convert radians to degrees.
  let deg(x) = x * 180 / calc.pi
  /// Convert degrees to radians.
  let rad(x) = x * calc.pi / 180

  /// Calculate the deflection angle for a given shock angle.
  let shock-polar(M, beta) = {
    calc.atan(
      2
        / calc.tan(beta)
        * (calc.pow(M, 2) * calc.pow(calc.sin(beta), 2) - 1)
        / (calc.pow(M, 2) * (KAPPA + calc.cos(2 * beta)) + 2),
    )
  }

  /// Calculate the normal mach number after a shock.
  let normal-mach-shock(M) = (
    calc.sqrt(
      (2 + (KAPPA - 1) * calc.pow(M, 2)) / (2 * KAPPA * calc.pow(M, 2) - (KAPPA - 1)),
    )
  )

  /// Calculate the mach number after the shock from the mach number before the shock.
  let shock-mach(mach_number, beta, theta) = (
    normal-mach-shock(mach_number * calc.sin(beta)) / calc.sin(beta - theta)
  )

  /// Shock angle that maximizes deflection for Mach $M$.
  let max-shock-angle(M) = golden-section-search(
    b => shock-polar(M, b),
    0,
    rad(90),
  )

  /// Densify samples near $theta = 0$ (same pattern as the original double loops).
  let densify-near-zero(max-angle) = (
    lq
      .linspace(0, max-angle, num: 128)
      .enumerate()
      .map(((i, t)) => {
        if i == 1 { lq.linspace(0, t, num: 10) } else { (t,) }
      })
      .flatten()
  )

  /// Residual for finding the $hat(M) = 1$ locus at fixed upstream Mach.
  let mach-1-residual(M, shock-angle) = {
    shock-mach(M, shock-angle, shock-polar(M, shock-angle).rad()) - 1
  }

  /// Plot $(theta(beta), beta)$ from $(M, beta)$ sample pairs.
  let polar-curve-plot(data, ..plot-args) = lq.plot(
    data.map(((M, b)) => shock-polar(M, b).deg()),
    data.map(((_, b)) => deg(b)),
    color: black,
    mark: none,
    ..plot-args,
  )

  // Can't start at 0, because there's a division by tan(shock-angle) = 0.
  let shock-angles = lq.linspace(1e-9, 90, num: 256)
  // float.inf doesn't produce the correct result.
  let infinity = 1e100
  let mach-numbers = (
    1.05,
    1.1,
    1.15,
    1.2,
    1.25,
    1.3,
    1.35,
    1.4,
    1.45,
    1.5,
    1.6,
    1.7,
    1.8,
    1.9,
    2,
    2.1,
    2.2,
    2.3,
    2.4,
    2.5,
    2.6,
    2.8,
    3,
    3.2,
    3.4,
    3.5,
    3.6,
    3.8,
    4,
    4.5,
    5,
    6,
    8,
    10,
    15,
    20,
    infinity,
  )
  let highlighted-mach-numbers = (1.5, 2, 2.5, 3, 3.5, 4, 5, 10)

  // Generate shock angle plots for all Mach numbers
  let shock-angle-plots = (
    mach-numbers
      .map(M => {
        let deflection-angles = shock-angles.map(b => shock-polar(
          M,
          rad(b),
        ).deg())
        let max-deflection-angle = calc.max(..deflection-angles)
        let weak-solution-index = deflection-angles.position(t => (
          t == max-deflection-angle
        ))
        let thickness = if M in highlighted-mach-numbers { 1.2pt } else {
          0.5pt
        }

        (
          // weak solution
          lq.plot(
            deflection-angles.slice(0, weak-solution-index + 1),
            shock-angles.slice(0, weak-solution-index + 1),
            color: black,
            stroke: (thickness: thickness),
            mark: none,
          ),
          // strong solution
          lq.plot(
            deflection-angles.slice(weak-solution-index),
            shock-angles.slice(weak-solution-index),
            color: black,
            stroke: (thickness: thickness, dash: "dashed"),
            mark: none,
          ),
        )
      })
      .flatten()
  )

  // Calculate maximum deflection angle for M = infinity
  let max-deflection-angle = shock-polar(
    infinity,
    max-shock-angle(infinity),
  ).rad()

  // Helper function to find Mach number for given deflection angle
  let find-mach-for-deflection(deflection-angle) = {
    let M = secant(
      M => shock-polar(M, max-shock-angle(M)).rad() - deflection-angle,
      rad(60),
      rad(70),
    )
    if M == none { M = infinity }
    M
  }

  // Reuse the expensive Mach roots for both boundary curves.
  let deflection-mach-pairs = densify-near-zero(max-deflection-angle).map(
    deflection-angle => (
      deflection-angle,
      find-mach-for-deflection(deflection-angle),
    ),
  )

  // Generate solution border data
  let solution-border-data = deflection-mach-pairs.map(((_, M)) => (
    M,
    max-shock-angle(M),
  ))
  let solution-border-plot = polar-curve-plot(solution-border-data)

  // Generate Mach 1 line data
  let mach-1-data = deflection-mach-pairs.map(((_, M)) => {
    let shock-angle = secant(
      shock-angle => mach-1-residual(M, shock-angle),
      rad(60),
      rad(70),
      tolerance: 1e-6,
    )
    (M, shock-angle)
  })

  let mach-1-plot = polar-curve-plot(mach-1-data, stroke: (dash: "dash-dotted"))

  let label-text-size = 12pt
  let custom-label-placements = (
    "3.4": (coordinates: (34, 68), line: ((34.7, 67.9), 67)),
    "3.8": (coordinates: (38.8, 68.5), line: ((38.8, 68.5), 67.3)),
    "15": (coordinates: (45.2, 69.2), line: ((45.2, 69.2), 69)),
    "20": (coordinates: (45.1, 72.3), line: ((45.1, 72.3), 71.2)),
    str(infinity): (coordinates: (45.2, 63), line: ((45.5, 63.6), 64.1)),
  )

  // One label per Mach number, sitting at that curve's maximum-deflection tip unless
  // `custom-label-placements` moves it aside, in which case a leader line is added.
  let mach-label(M) = {
    let highlighted = M in highlighted-mach-numbers
    let custom = custom-label-placements.at(str(M), default: none)
    let ((x, y), pad-x, pad-y) = if custom == none {
      // only the un-nudged labels need the (expensive) maximum-deflection search
      let tip = max-shock-angle(M)
      ((shock-polar(M, tip).deg(), deg(tip)), 0.07em, 0.3em)
    } else { (custom.coordinates, 0em, 0em) }

    let label = if M == infinity { $#sym.infinity$ } else { [#M] }
    if highlighted { label = strong(label) }
    let body = pad(x: pad-x, y: pad-y, text(size: label-text-size)[$#label$])
    let labels = (
      lq.place(x, y, align: if highlighted { top + left } else { bottom + left }, body),
    )

    if custom != none {
      let ((leader-x, leader-y), target-angle) = custom.line
      labels.push(lq.plot(
        (leader-x, shock-polar(M, rad(target-angle)).deg()),
        (leader-y, target-angle),
        color: black,
        stroke: (thickness: 0.5pt),
        mark: none,
      ))
    }
    labels
  }

  // hat(M) = 1 label, pinned to where that locus crosses the M = 1.4 polar
  let mach-1-label = {
    let M = 1.4
    let shock-angle = deg(secant(angle => mach-1-residual(M, angle), rad(60), rad(70)))
    lq.place(
      shock-polar(M, rad(shock-angle)).deg(),
      shock-angle,
      align: top + right,
      pad(0.2em, text(size: label-text-size)[$hat(M) = 1$]),
    )
  }

  let label-plots = mach-numbers.map(mach-label).flatten() + (mach-1-label,)

  // Geometry drawing
  let geometry-drawing = cetz.canvas(
    length: 3cm,
    background: none,
    stroke: (thickness: 0.5pt, paint: black),
    padding: 0.2cm,
    {
      let theta = 15deg
      let beta = 65deg
      let M-length = 0.8
      let M-shock-length = 0.7

      set-style(
        mark: (fill: black, scale: 1.5),
        stroke: (thickness: 0.5pt),
        angle: (radius: 0.3, label-radius: .22),
        content: (padding: 2pt),
      )

      // angles
      for (angle, radius, label, label_radius) in (
        (beta, 0.45, $#sym.beta$, 80%),
        (theta, 0.54, $#sym.theta$, 120%),
      ) {
        cetz.angle.angle(
          (0, 0),
          (1, 0),
          (1, calc.tan(angle)),
          radius: radius,
          label: label,
          label-radius: label_radius,
          mark: (end: ">", scale: 0.5),
        )
      }

      let strong-stroke = (thickness: 1.2pt)

      line(
        (-M-length, 0),
        (0, 0),
        mark: (end: "stealth"),
        stroke: strong-stroke,
        name: "mach",
      )
      content("mach.mid", $M$, anchor: "south")
      line(
        (0, 0),
        (M-shock-length * calc.cos(theta), M-shock-length * calc.sin(theta)),
        mark: (end: "stealth"),
        stroke: strong-stroke,
        name: "mach-shock",
      )
      content(
        ("mach-shock.start", 90%, "mach-shock.end"),
        $hat(M)$,
        angle: "mach-shock.end",
        padding: 0.07,
        anchor: "south",
      )
      line((0, 0), (M-length, 0), stroke: strong-stroke + (dash: (8pt, 4pt)))

      // shock
      let slope = calc.tan(beta)
      let (x1, x2) = (-0.2, 0.4)
      line((x1, x1 * slope), (x2, x2 * slope))

      let shift = 0.01
      line(
        (x1 - shift, x1 * slope + shift),
        (x2 - shift, x2 * slope + shift),
        name: "shock-line",
      )

      content(
        ("shock-line.start", 65%, "shock-line.end"),
        text(size: 12pt)[shock],
        angle: "shock-line.end",
        anchor: "south",
      )
    },
  )

  let drawing-plot = lq.place(80%, 88%, geometry-drawing)

  // Legend
  let legend-plots = (
    lq.plot((), (), color: black, mark: none, label: "strong solution"),
    lq.plot(
      (),
      (),
      color: black,
      stroke: (dash: "dashed"),
      mark: none,
      label: "weak solution",
    ),
  )

  let plots = (
    shock-angle-plots
      + (solution-border-plot, mach-1-plot, drawing-plot)
      + legend-plots
      + label-plots
  )

  set page(width: auto, height: auto, margin: 1cm, fill: none)
  set text(font: "New Computer Modern")
  set align(center)

  let axis = (tick-distance: 2, subticks: 1)
  let dof = calc.round(2 / (KAPPA - 1), digits: 3)

  lq.diagram(
    width: 24cm,
    height: 26cm,
    xlim: (0, 46),
    ylim: (0, 90),
    xaxis: axis,
    yaxis: axis,
    legend: (fill: rgb("#cdd3da")),
    title: text(size: 16pt)[Diatomic gas ($f = dof$, $kappa = KAPPA$)],
    xlabel: [deflection angle $theta$ [°]],
    ylabel: [shock angle $beta$ [°]],
    ..plots,
  )
}