« home

Wyckoff Positions

(original)

physicssolid state physicssymmetriesgroup theorycetztikz

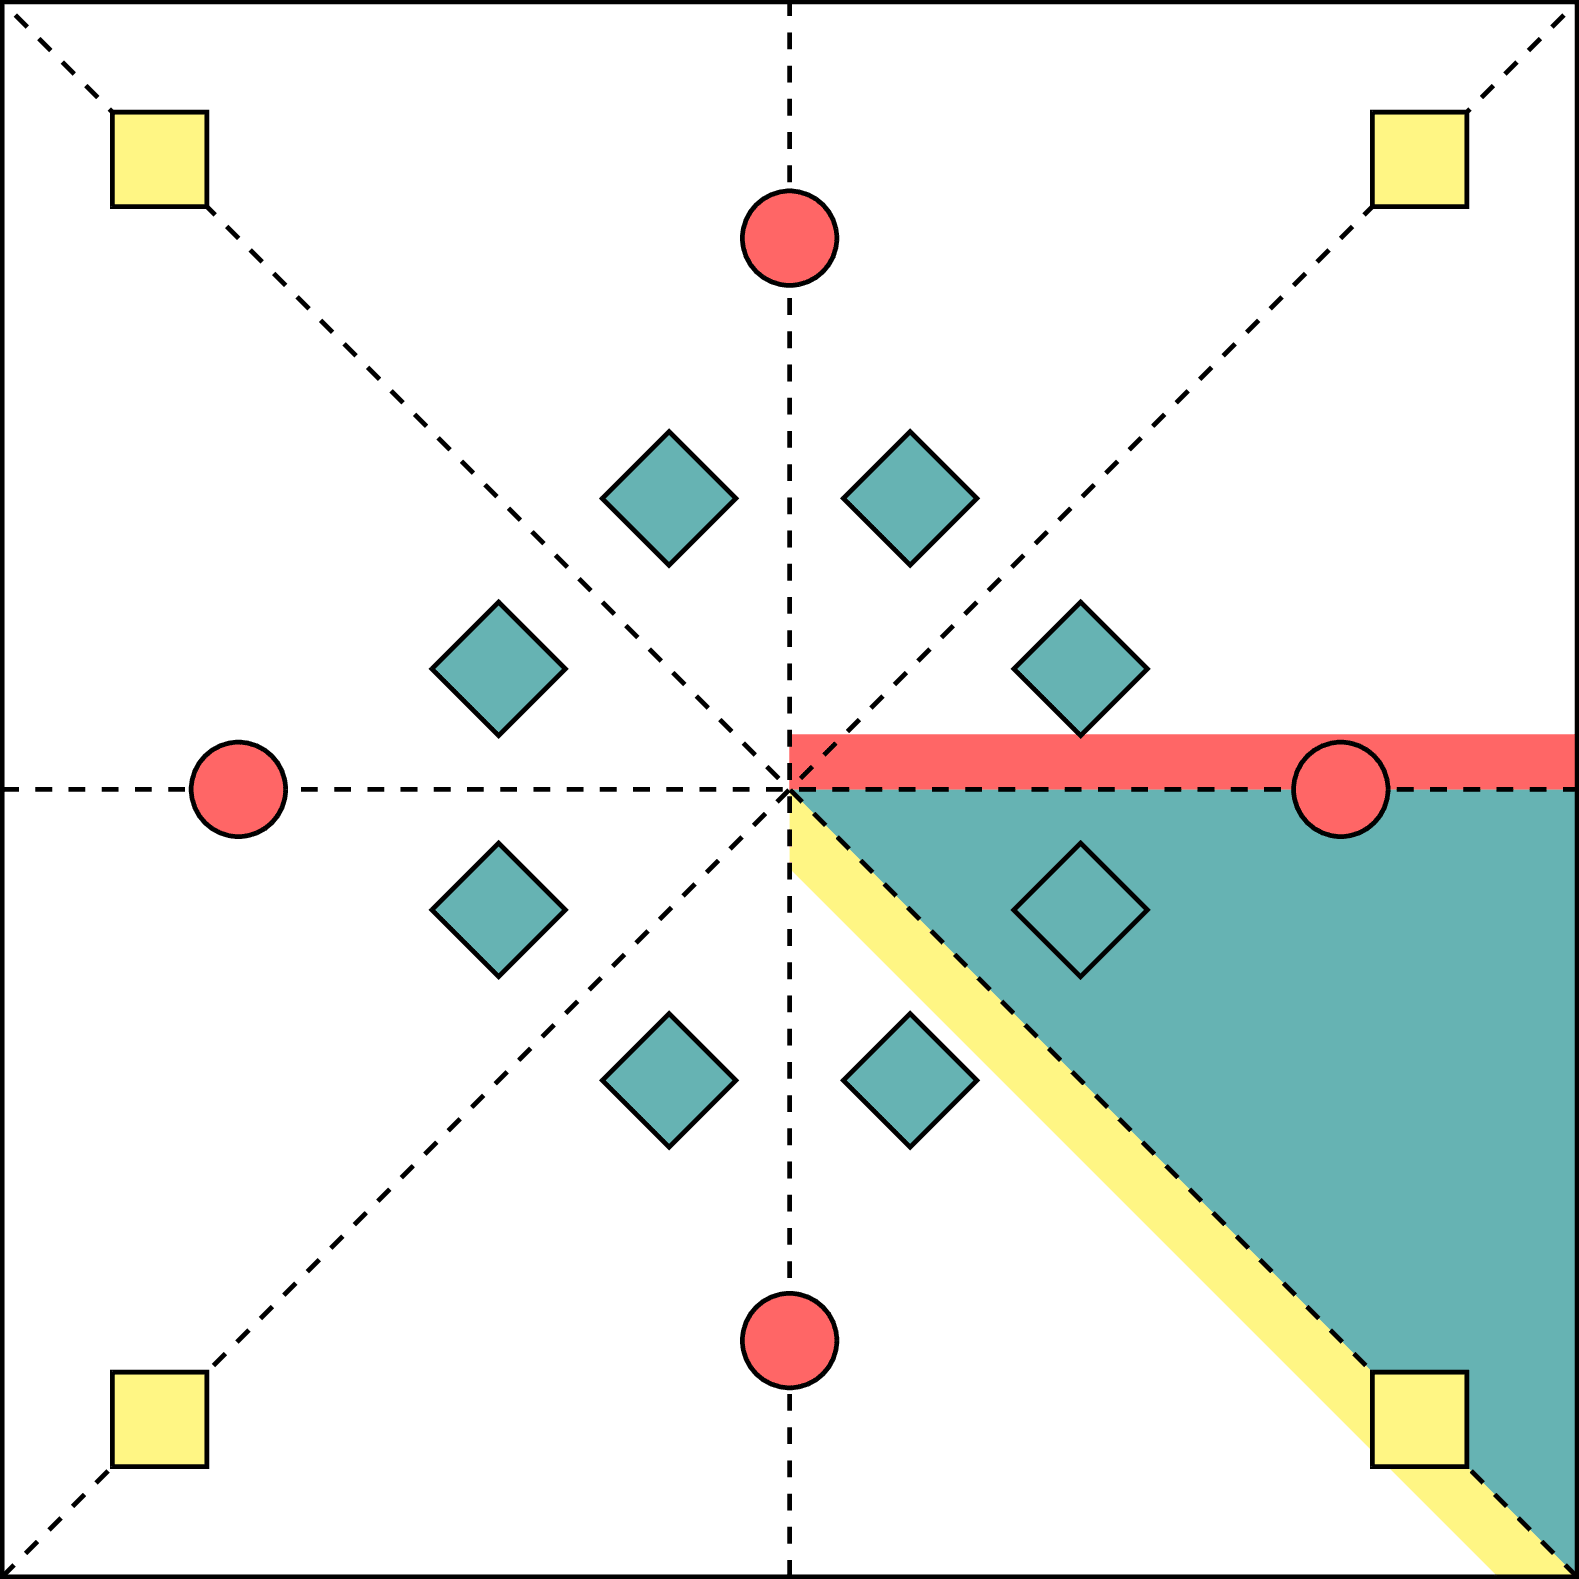
Unit cell representation of a 2D crystal with p4m symmetry and three occupied Wyckoff positions. The shaded areas highlight the asymmetric unit and the site-symmetries of the atoms, indicating the region of the unit cell the each atom is constrained to lie in by specifying tis anonymized Wyckoff position. Reproduced from fig. 1 in "Wyckoff Set Regression for Materials Discovery" by Rhys Goodall, inspired by PyXtal docs.

Wyckoff Positions

  Download

PNG

  Code

  LaTeX

wyckoff-positions.tex (25 lines)

\documentclass[tikz]{standalone}

\begin{document}
\begin{tikzpicture}[thick]
  \def\r{5}
  \fill[teal!60] (\r,-\r) -- (0,0) -- (\r,0) -- cycle;
  \fill[yellow!60] (\r,-\r) -- (0,0) -- (0,-0.\r) -- (4.\r,-\r) -- cycle;
  \fill[red!60] (0,0) rectangle (\r,0.3\r);
  \draw (-\r,-\r) rectangle (\r,\r);
  \draw[dashed] (-\r,-\r) -- (\r,\r) (\r,-\r) -- (-\r,\r) (-\r,0) -- (\r,0) (0,-\r) -- (0,\r);

  \foreach \a in {-0.8*\r,0.8*\r}
  \foreach \b in {-0.8*\r,0.8*\r}
  \draw[fill=yellow!60] (\a,\b) +(-0.3,-0.3) rectangle +(0.3,0.3);

  \foreach \a in {-0.7*\r,0.7*\r} {
      \draw[fill=red!60] (\a,0) circle (0.3);
      \draw[fill=red!60] (0,\a) circle (0.3);
    }

  \foreach \i in {1,...,8}
  \draw[rotate=45,fill=teal!60] (\i*360/8+22.5:2cm) +(-0.3,-0.3) rectangle +(0.3,0.3);
\end{tikzpicture}
\end{document}

  Typst

wyckoff-positions.typ (88 lines)

#import "@preview/cetz:0.3.2": canvas, draw

#set page(width: auto, height: auto, margin: 8pt)

#canvas({
  import draw: rect, line, circle, rotate

  let size = 5 // Base radius/size
  let small-square = 0.3 // Size of small squares
  let circle-radius = 0.3 // Size of circles

  // Define colors
  let colors = (
    teal: rgb("#19d4d4"),
    yellow: rgb("#f3f380"),
    red: rgb("#f36969"),
  )

  // Fill colored regions
  // Teal triangle
  line(
    (0, 0),
    (size, 0),
    (size, -size),
    fill: colors.teal,
    name: "teal-triangle",
    close: true,
    stroke: none,
  )

  // Yellow region
  line(
    (size - .5, -size),
    (0, -.5),
    (0, 0),
    (size, -size),
    fill: colors.yellow,
    name: "yellow-region",
    close: true,
    stroke: none,
  )

  // Red rectangle
  rect((0, 0), (size, 0.35), fill: colors.red, name: "red-rect", stroke: none)

  // Main square outline
  rect((-size, -size), (size, size), name: "main-square")

  // Dashed lines
  let dash-style = (stroke: (dash: "dashed"))
  line((-size, -size), (size, size), ..dash-style, name: "diag1")
  line((size, -size), (-size, size), ..dash-style, name: "diag2")
  line((-size, 0), (size, 0), ..dash-style, name: "horiz")
  line((0, -size), (0, size), ..dash-style, name: "vert")

  // Corner squares (yellow)
  for a in (-0.8 * size, 0.8 * size) {
    for b in (-0.8 * size, 0.8 * size) {
      rect(
        (a - small-square, b - small-square),
        (a + small-square, b + small-square),
        fill: colors.yellow,
        name: "corner-square-" + str(a).replace(".", "p") + "-" + str(b).replace(".", "p"),
      )
    }
  }

  // Red circles on axes
  for a in (-0.7 * size, 0.7 * size) {
    circle((a, 0), radius: circle-radius, fill: colors.red, name: "horiz-circle-" + str(a).replace(".", "p"))
    circle((0, a), radius: circle-radius, fill: colors.red, name: "vert-circle-" + str(a).replace(".", "p"))
  }

  // Rotated teal squares
  rotate(45deg)
  for i in range(8) {
    let angle = i * 360deg / 8 + 22.5deg
    let x = 2 * calc.cos(angle)
    let y = 2 * calc.sin(angle)
    rect(
      (x - small-square, y - small-square),
      (x + small-square, y + small-square),
      fill: colors.teal,
      name: "rot-square-" + str(i).replace(".", "p"),
    )
  }
})